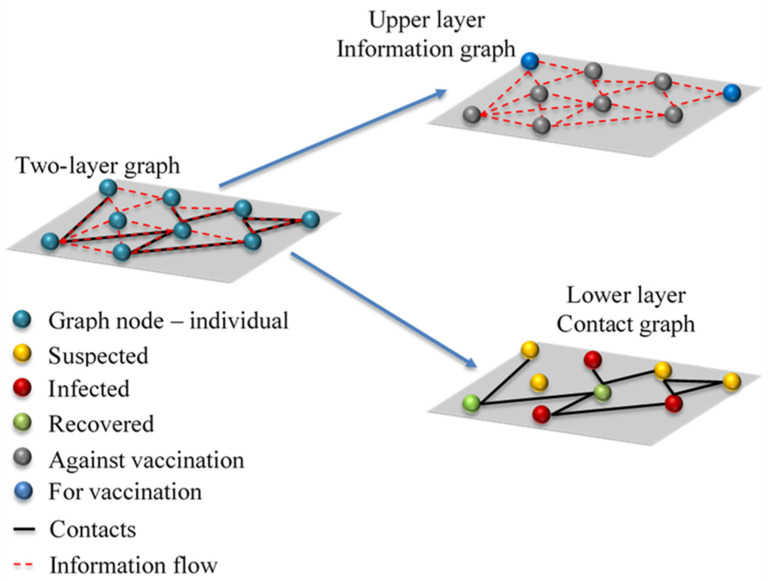
Figure 1.
Schematic representation of two-layer graph composed of information and contact graphs. Left side—interplay between contact and information layers, top right corner—information layer, red line represents information flow, grey circles represent individuals against vaccination, and blue circles represent individuals opting for vaccination, bottom right corner—contact layer, black lines represent infection vectors, yellow circles represent suspected individuals, green circles represent recovered and/or vaccinated individuals, and red circles represent individuals in one of the infection stages.

