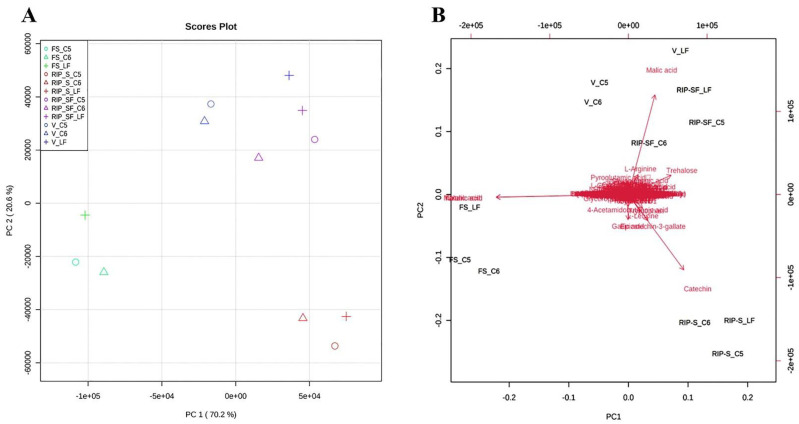
Figure 4.
Principal components analysis (PCA) 2D score plot (A) and biplot (B) of the muscadine metabolites at selected developmental stages. The different short abbreviations in the biplot manifest the scores of the observations (i.e., muscadine genotypes). The vectors that point toward the same direction correspond to the variables (i.e., metabolites) with similar response profiles. The green color of the oval, triangle, and cross shape represents FS_C5, FS_C6, and FS_LF; blue represents V_C5, V_C6, and V_LF; purple represents RIP-SF_C5, RIP-SF_C6, and RIP-SF_LF; and red represents RIP-S_C5, RIP-S_C6, and RIP-S_LF. FS_LF: fruit-set_Late Fry; FS_C5: fruit-set_C5-9-1; FS_C6: fruit-set_C6-10-1; V_LF: veraison_Late Fry; V_C5: veraison_C5-9-1; V_C6: veraison_C6-10-1; RIP-SF_LF: ripening-skin/flesh_Late Fry; RIP-SF_C5: ripening-skin/flesh_C5-9-1; RIP-SF_C6: ripening-skin/flesh_C6-10-1; RIP-S_LF: ripening-seeds_Late Fry; RIP-S_C5: ripening-seeds_C5-9-1; RIP-S_C6: ripening-seeds_C6-10-1.

