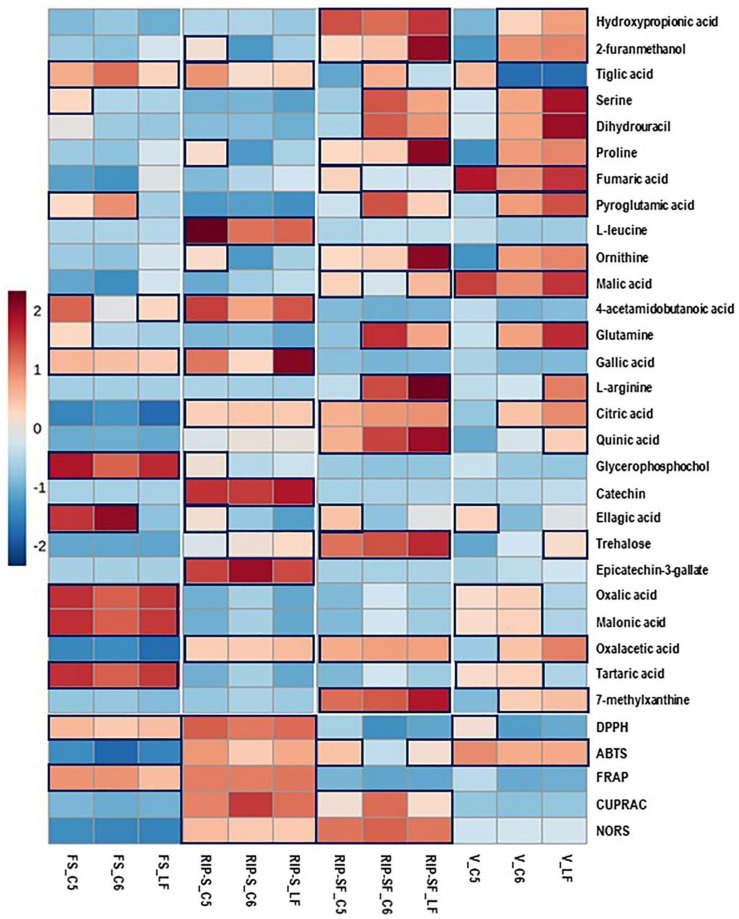
Figure 5.
Heatmap analysis of candidate metabolites (VIP > 0.5) obtained by partial least-squares–discriminant analysis (PLS-DA) and antioxidant activities of muscadine genotypes at selected developmental stages. Each column refers to the muscadine genotype at different developmental stages, and each row indicates the metabolites and antioxidant activities. The red and blue colors in the plot describe high and low intensities, and the values range from –2 to +2. The higher the red color intensity (from +1 to +2 values), the higher the metabolite contents and antioxidant activities; in contrast, the higher blue color intensity (from –1 to –2 values) represents lower metabolite contents and antioxidant activities. FS_LF: fruit-set_Late Fry; FS_C5: fruit-set_C5-9-1; FS_C6: fruit-set_C6-10-1; V_LF: veraison_Late Fry; V_C5: veraison_C5-9-1; V_C6: veraison_C6-10-1; RIP-SF_LF: ripening-skin/flesh_Late Fry; RIP-SF_C5: ripening-skin/flesh_C5-9-1; RIP-SF_C6: ripening-skin/flesh_C6-10-1; RIP-S_LF: ripening-seeds_Late Fry; RIP-S_C5: ripening-seeds_C5-9-1; RIP-S_C6: ripening-seeds_C6-10-1.

