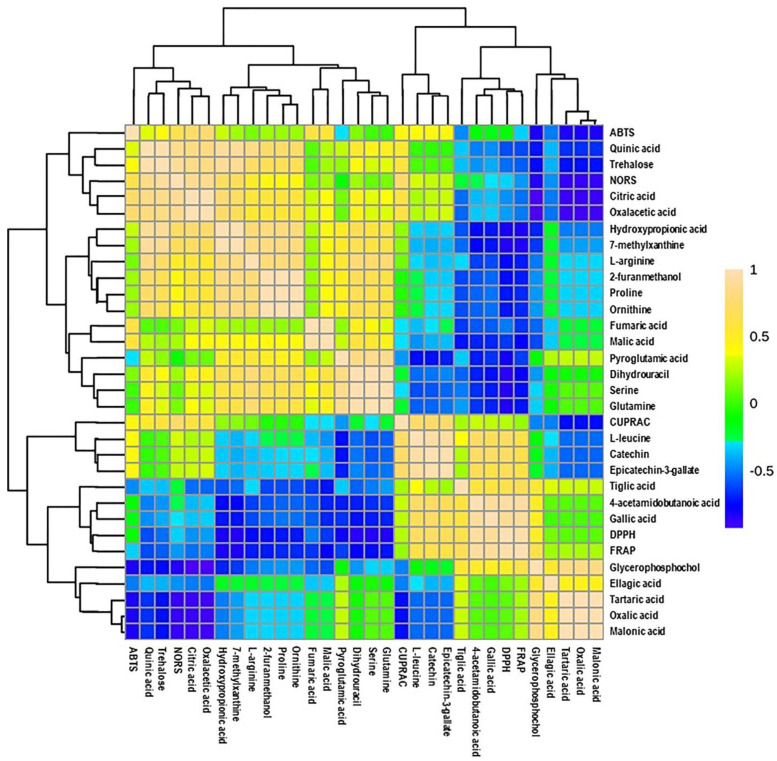
Figure 6.
Heatmap of Pearson correlation between candidate metabolites (VIP > 0.5) with antioxidant activities of muscadine genotypes at selected developmental stages. Correlation values range from –1 to +1. The values close to +1 represent the higher positive correlation, whereas values closer to zero mean there is no linear trend between the variables; values close to –1 represent the negative correlation between variables. FS_LF: fruit-set_Late Fry; FS_C5: fruit-set_C5-9-1; FS_C6: fruit-set_C6-10-1; V_LF: veraison_Late Fry; V_C5: veraison_C5-9-1; V_C6: veraison_C6-10-1; RIP-SF_LF: ripening-skin/flesh_Late Fry; RIP-SF_C5: ripening-skin/flesh_C5-9-1; RIP-SF_C6: ripening-skin/flesh_C6-10-1; RIP-S_LF: ripening-seeds_Late Fry; RIP-S_C5: ripening-seeds_C5-9-1; RIP-S_C6: ripening-seeds_C6-10-1.

