Figure 1.
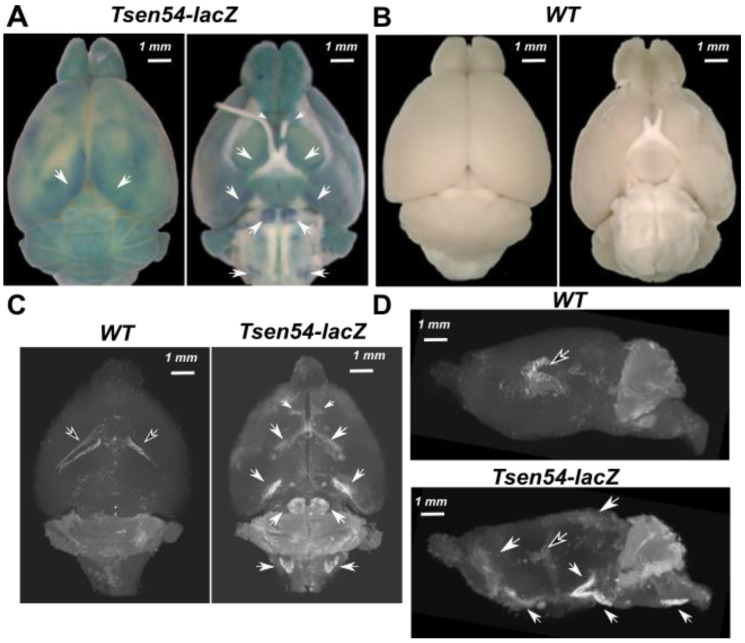
Three-dimensional imaging of Tsen54-lacZ expression in intact adult mouse brain by micro-CT. (A) Dorsal and ventral views of Tsen54-lacZ mouse brain stained with X-gal/FeCN and visualized by stereomicroscope; (B) dorsal and ventral views of littermate control whole mouse brain stained with X-gal/FeCN and visualized by stereomicroscope. (C) Representative maximum intensity projection (MIP) micro-CT images scanned with the resolution 5 μm/voxel of whole brain from Tsen54-lacZ (N = 3) and wild type (WT) (N = 3) animals. (D) Sagittal view of MIP images of the brains represented in panel (C). Additional regions of increased density (indicated by white arrows) in Tsen54-LacZ brains correspond to precipitated product of X-gal substrate converted by β-gal. White arrows indicate the regions of the elevated density in Tsen54-lacZ brains imaged by micro-CT and corresponding regions in the brains imaged by microscopy. The arrows filled with black indicate the endogenous densities detected both in the wild type and experimental brains.

