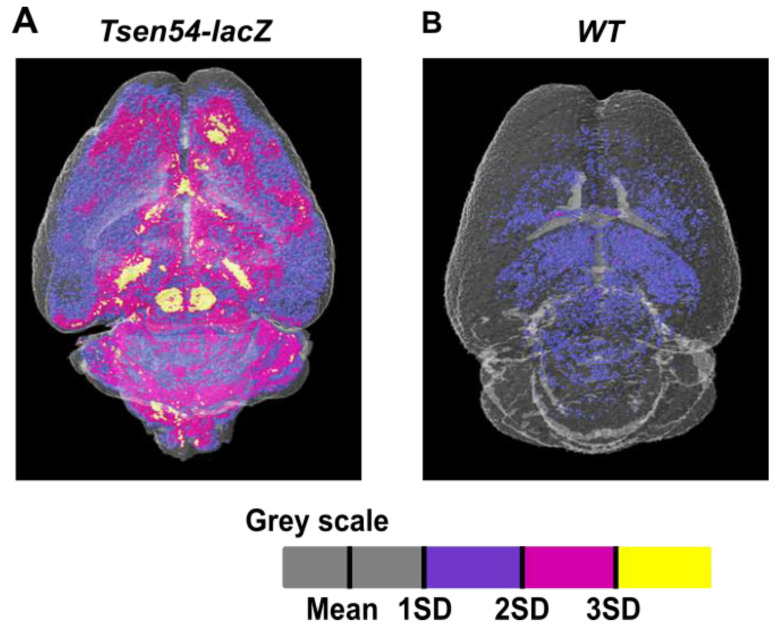
Figure 4.
Relative quantification of Tsen54-lacZ gene expression by micro-CT analysis. (A,B) The average grayscale values were calculated using three datasets from the Tsen54-lacZ brains using CTAN (Bruker) software. The sum of the average mean and one standard deviation was set up as a background of non-contrasted tissues (gray), while values outside of this range were color-coded: 1SD(Standard Deviation) to 2SD—blue (lowest brightness); 2SD to 3SD—magenta (intermediate); and 3SD and above (maximum)—yellow. These calculated values were applied to the datasets obtained from the Tsen54-lacZ (A) and wild type (B) brains. Resolution of the micro-CT original images is 20 μm/voxel.

