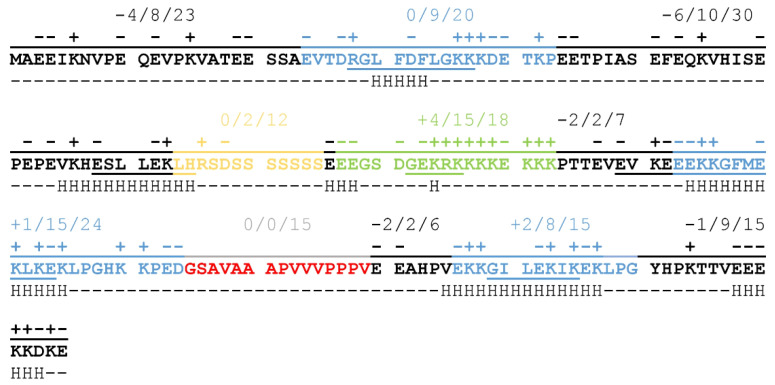
Figure 1.
Conserved segments, charge distribution, in silico, and experimental α-helical propensities of the ERD14 protein. Conserved regions: Ka-, Kb-, Kc- (blue), S- (yellow), Chp- (green), and H-segment (red) indicated in the sequence of ERD14. In addition to individual charges above the regions, net charge/number of charged side chains/length of regions summed up. Underlined letters show residues with α-helical propensity calculated from nuclear magnetic resonance (NMR) chemical shifts [9,16] by δ2D method [17]. Below the residues, H indicates the α-helical propensity estimated by in silico PredictProtein analysis [18,19,20].

