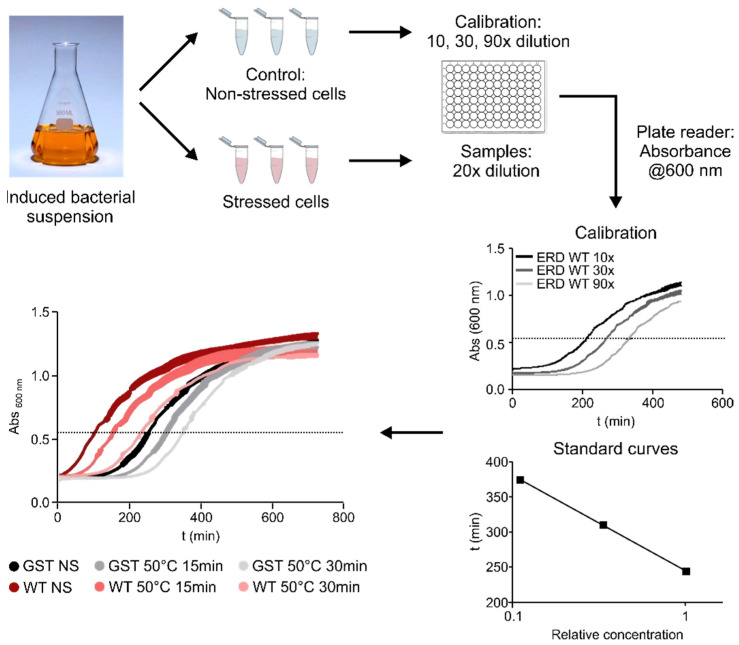
Figure 2.
Overview of the viability assay. After a standard induction period, cells were stressed by a heat shock of 50 °C for 15 min (final set-up, after optimization of the stress conditions by screening at different temperatures for different time length shown at the left bottom panel). Viability of stressed and non-stressed samples were compared based on their cell growth after appropriate dilution in fresh medium (Calibration—grey curves). Cell growth was followed by absorbance at 600 nm. Half-time of growth curves varies linearly, with dilution plotted on a logarithmic scale, i.e., it is informative of the concentration of viable cells in the sample. For our experiments, we have set the OD at 0.6 as this period of growth by convention and applied serial dilutions to obtain the calibration curve and calculate the relative survival ratios of the different samples (NS: non-stressed samples, S: stressed samples). Based on this, we can compare the viability of cells exposed to the same stress conditions but expressing various constructs (colored curves).

