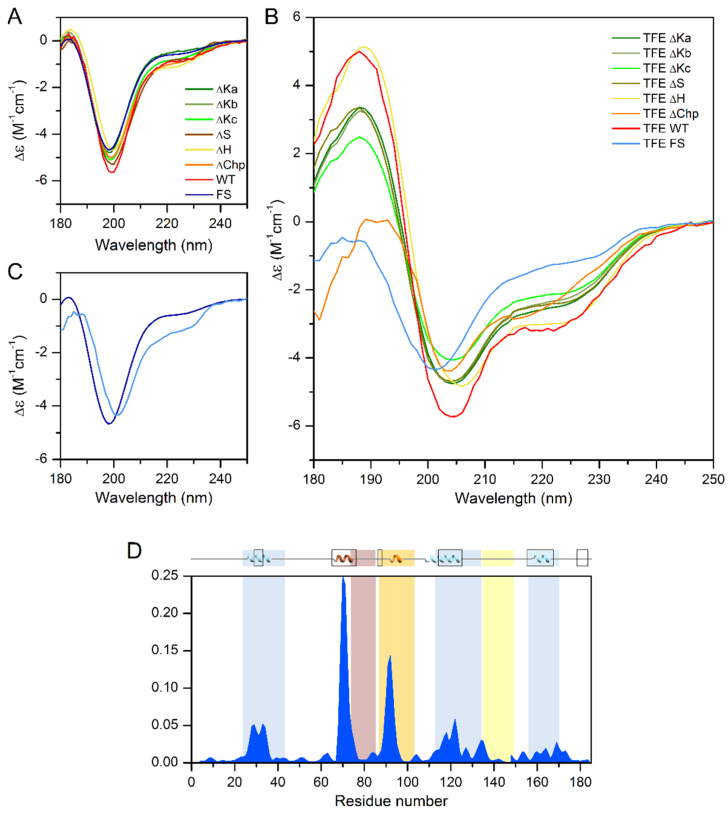
Figure 4.
CD measurements of single deletion mutants and Full-Scr construct of ERD14 with TFE induced secondary structure changes. (A) Circular dichroism spectra of the ∆Ka-, ∆Kb-, ∆Kc-, ∆S-, ∆H-, ∆Chp-, and Full-Scr (FS) constructs of ERD14, recorded in 10 mM Na-phosphate buffer (pH 7.4), indicating similar, mainly disordered, structures, which is demonstrated by a characteristic minimum below 200 nm and low amplitude around 220 nm. (B) CD spectra of the different constructs of ERD14 recorded in Na-phosphate buffer containing 30% TFE. There are significant differences in the extent of the induced secondary structure, as shown by the spectral differences between the variants. (C) Comparison of the CD spectra of the FS ERD14 variant in native (dark blue) and in 30% TFE containing (light blue) buffer, indicating minor effects of TFE on the structure of the variant with scrambled sequence. (D) The degrees of formation of α-helices (blue areas) obtained with the δ2D method [17] using Nuclear Magnetic Resonance Chemical shifts mapped to the WT ERD14 sequence, and its graphical representation inserted above the diagram shows good accordance with the in-silico estimated α-helix content [20] (boxes at the top).

