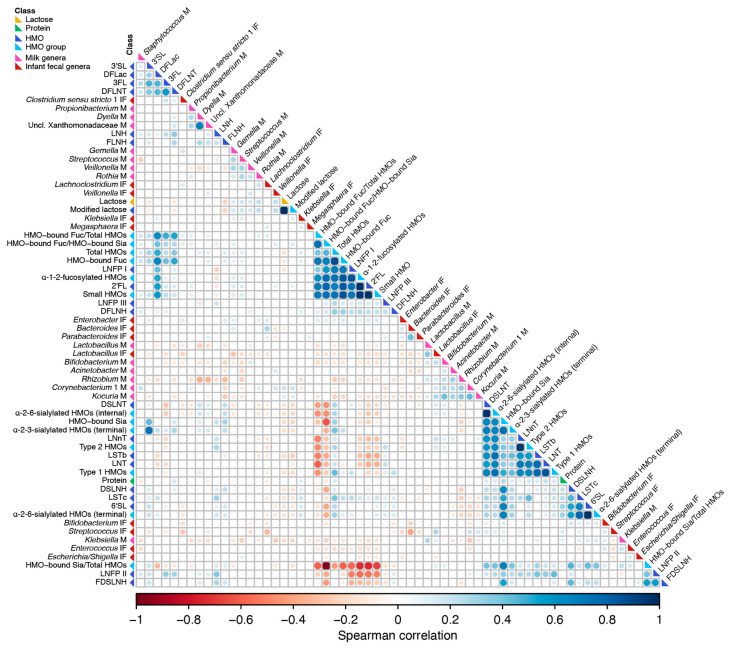
Figure 4.
Correlations among microbial taxa and milk factors. Spearman rank correlations among milk (M) and infant fecal (IF) microbial taxa, lactose, protein, HMOs, and HMO groupings are shown (n = 340 paired dyads). Only correlations with FDR p ≤ 0.1 are shown. The size of the circle represents the magnitude of the correlation, and the color represents the direction of the correlation: red (negative) and blue (positive). Features were hierarchically clustered based on Spearman correlations. Feature classes are denoted by the colored squares next to the feature name on the left, as follows: light blue, individual HMOs; dark blue, HMO groupings; light green, lactose; dark green, protein; milk genera, pink; infant fecal genera, purple. 2′-fucosyllactose (2′FL), 3-fucosyllactose (3FL), lacto-N-neotetraose (LNnT), 3′-sialyllactose (3′SL), difucosyllactose (DFlac), 6′-sialyllactose (6′SL), lacto-N-tetraose (LNT), lacto-N-fucopentaose (LNFP) I, LNFP II, LNFP III, sialyl-LNT (LST) b, LSTc, difucosyllacto-LNT (DFLNT), lacto-N-hexaose (LNH), disialyllacto-N-tetraose (DSLNT), fucosyllacto-N-hexaose (FLNH), difucosyllacto-N-hexaose (DFLNH), fucodisialyllacto-lacto-N-hexaose (FDSLNH) and disialyllacto-N-hexaose (DSLNH); small HMOs (2′FL, 3FL, 3′SL, 6′SL, and DFLac), modified lactose (small HMOs and lactose), type 1 HMOs (LNT, LNFP I, LNFP II, LSTb, and DSLNT), type 2 HMOs (LNnT, LNFP III, and LSTc), α-1-2-fucosylated HMOs (2′FL and LNFP I), terminal α-2-6-sialylated HMOs (6′SL and LSTc), internal α-2-6-sialylated HMOs (DSLNT and LSTb), terminal α-2-3-sialylated HMOs (3′SL and DSLNT), ratio of HMO-bound sialic acid (Sia) to total HMOs (HMO-bound Sia/total HMOs), ratio of HMO-bound fucose (Fuc) to total HMOs (HMO-bound Fuc/total HMOs), and ratio of the ratio of HMO-bound Fuc to HMO-bound Sia (HMO-bound Fuc/HMO-bound Sia).

