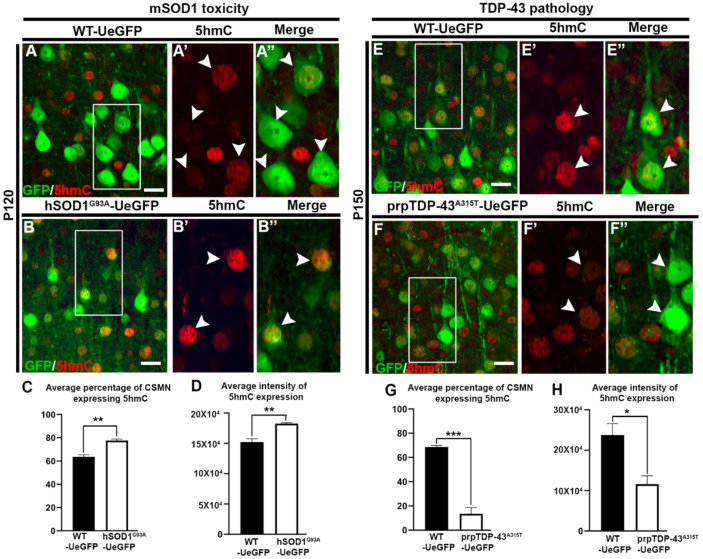
Figure 2.
CSMN that are diseased owing to mSOD1 toxicity, and TDP-43 pathology display differential expression of 5-hydroxymethylcytosine (5hmC). (A) Representative image of layer V of motor cortex from WT-UeGFP mouse at P120 showing GFP-labelled CSMN and 5hmC expression. Box enlarged (A′,A″, arrow heads). (B) Representative image of layer V of motor cortex from hSOD1G93A-UeGFP mouse at P120 showing GFP-labelled CSMN and 5hmC expression. Box enlarged (B′,B″, arrow heads). (C) Quantitative analysis of average percentage of CSMN expressing 5hmC in hSOD1G93A-UeGFP mouse at P120. (D) Quantitative analysis of average intensity of 5hmC expression in CSMN of hSOD1G93A-UeGFP mouse at P120. (E) Representative image of layer V of motor cortex from WT-UeGFP mouse at P150 showing GFP-labelled CSMN and 5hmC expression. Box enlarged (E′,E″, arrow heads). (F) Representative image of layer V of motor cortex from prp-TDP-43A315T-UeGFP mouse at P150 showing GFP-labelled CSMN and 5hmC expression. Box enlarged (F′,F″, arrow heads). (G) Quantitative analysis of average percentage of CSMN expressing 5hmC in prp-TDP-43A315T-UeGFP mouse at P150. (H) Quantitative analysis of average intensity of 5hmC expression in CSMN of prp-TDP-43A315T-UeGFP mouse at P150. * p < 0.025, ** p < 0.001, *** p < 0.0005; Scale bar: 20 µm.

