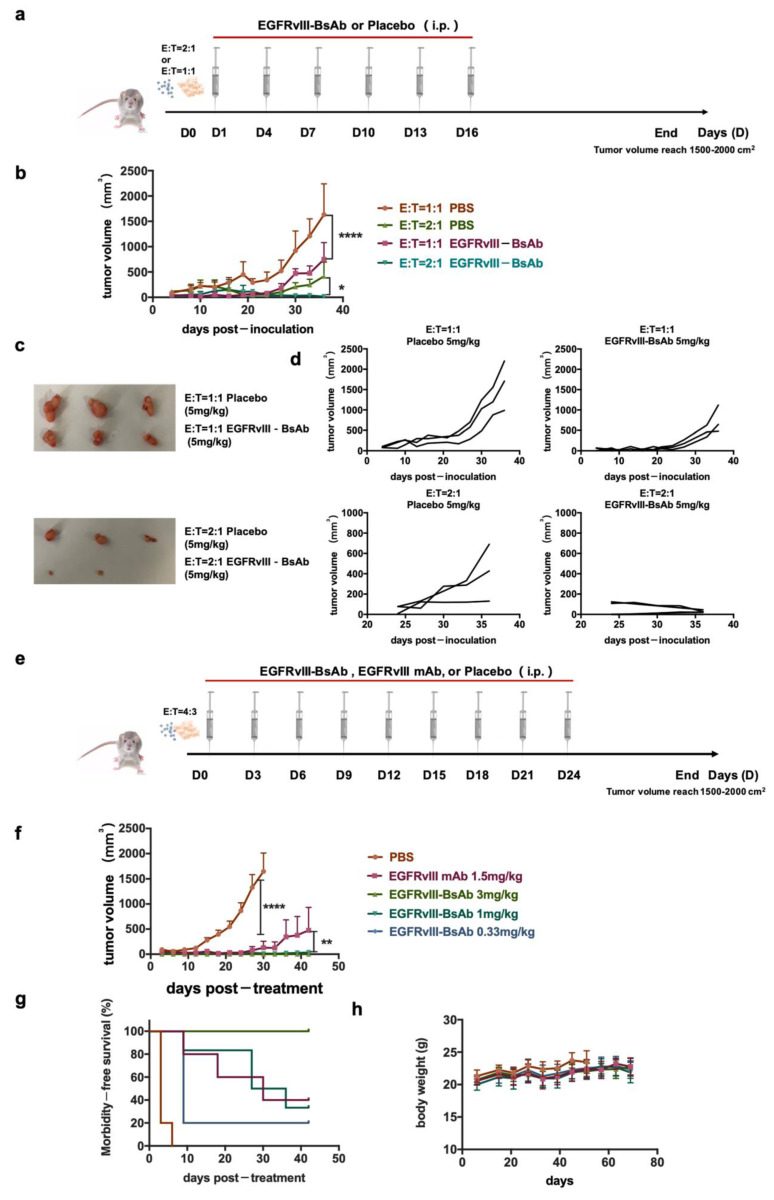
Figure 5.
EGFRvIII-expression of tumor growth inhibition in vivo by EGFRvIII-BsAb. (a) Schematic schedule of tumor inoculation and treatment. (b) Time course of U87MG.ΔEGFR tumor-growing. Data are presented as mean ± SEM (p < 0.0332 (*), p < 0.0001 (****)). (c) Images of stripped tumors. (d) U87MG.ΔEGFR tumor-growing time course under various E/T ratios. Data are presented as measured tumor volumes from individual mice. (e) Schematic schedule of tumor inoculation and treatment. (f) Tumor-growing time course(p < 0.0021 (**), p < 0.0001 (****)). (g) Morbidity time course. (h) Body-weight time course.

