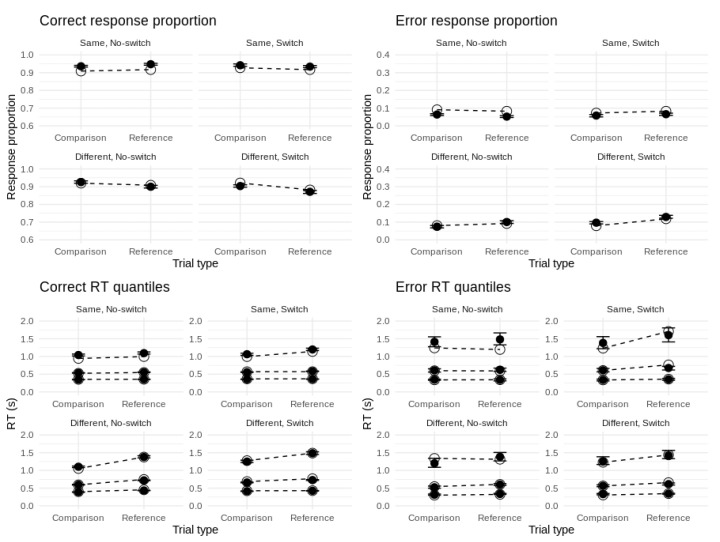
Figure 5.
Fits of top model to behavioral data. Top panels: Fits to correct and error proportions. Bottom panels: Fits to the 0.1, 0.5, and 0.9 quantiles of correct and error RT distributions. Unfilled circles represent data effects. Filled circles represent posterior model predictions with 95% credible intervals.

