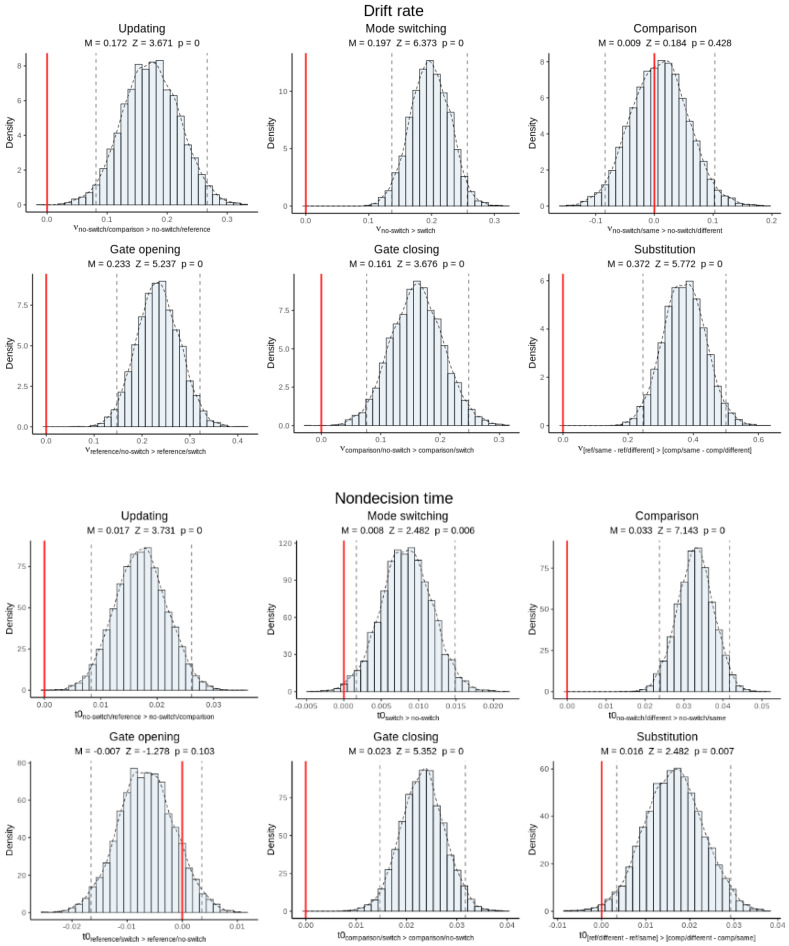
Figure 8.
Posterior inference on canonical cost effects for hyper-mean drift rate (top panels) and non-decision time parameters (bottom panels). Each panel shows a histogram of the posterior distribution as well as the posterior mean, Z-score, and p-value of the effect. Dotted lines represent 95% credible intervals. Red lines indicate the zero point. Visually, if the red line appears outside of the credible interval, then the effect is significant. The x-axis labels state how the contrast is calculated.

