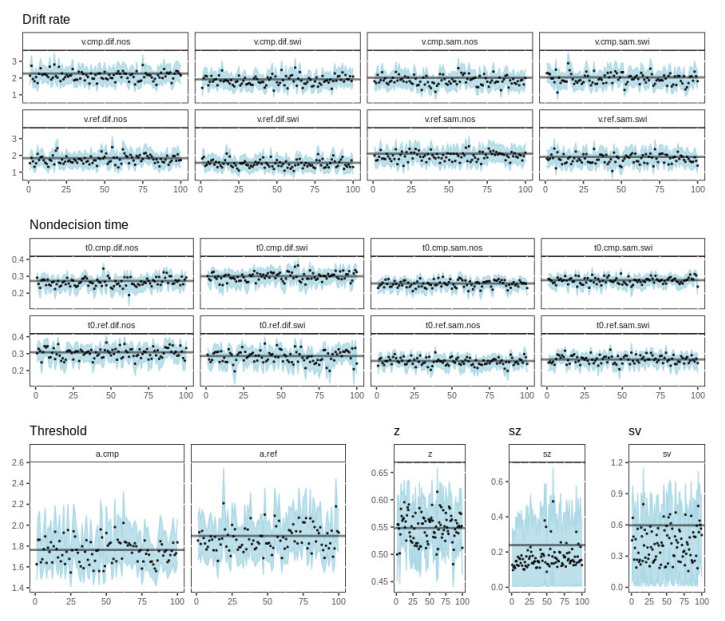
Figure A1.
Parameter recovery for the top model. Each panel shows the recovered parameter values for 100 synthetic subjects (black dots) plotted against the known data-generating value (horizontal lines). The shaded region represents the 95% credible interval surrounding the recovered value. Note: z = starting point, sz = starting point variability, sv = drift rate variability.

