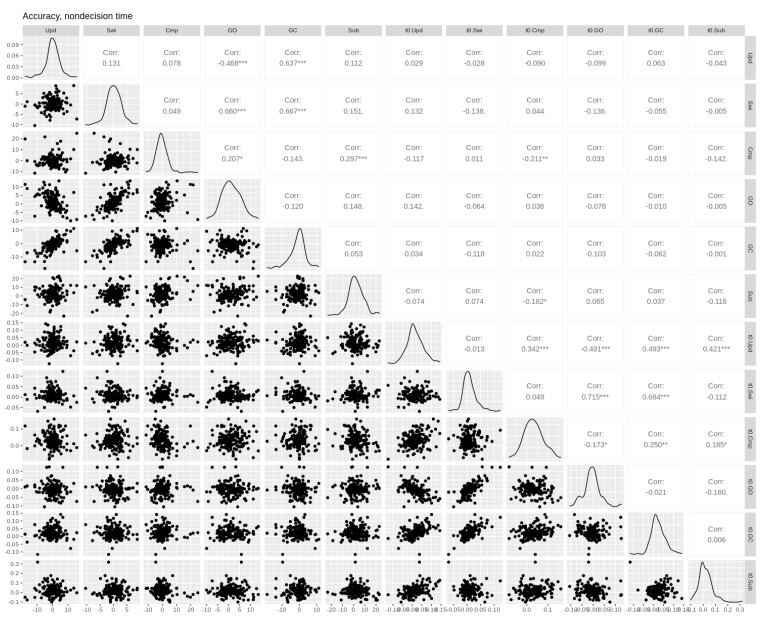
Figure A4.
Pairwise Pearson correlations between non-decision time and accuracy cost effects. Empirical effects are shown in the first six columns. Parameter effects are shown in the last six columns (prefixed with the parameter name). Upd = updating, Swi = switching, Cmp = comparison, GO = gate opening, GC = gate closing, Sub = substitution. Asterisks *, **, and *** denote p-values of <0.05, <0.01, and <0.001, respectively.

