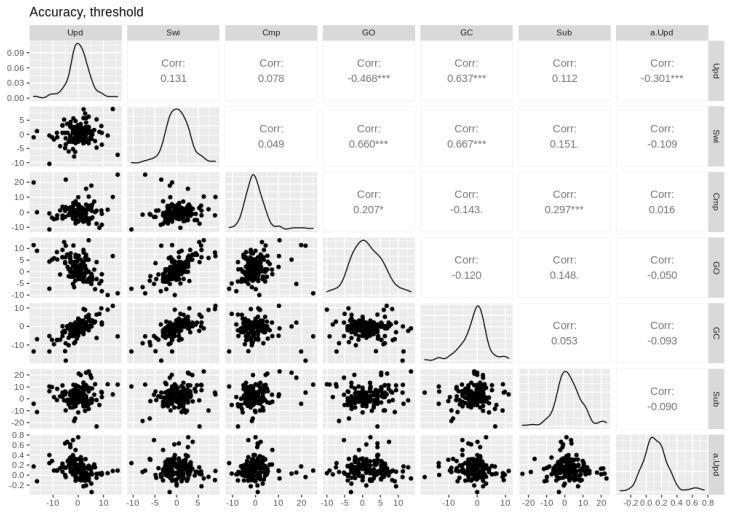
Figure A6.
Pairwise Pearson correlations between threshold and accuracy cost effects. Empirical effects are shown in the first six columns. Parameter effects are shown in the last column (prefixed with the parameter name). Upd = updating, Swi = switching, Cmp = comparison, GO = gate opening, GC = gate closing, Sub = substitution. Asterisks * and *** denote p-values of <0.05, <0.01, and <0.001, respectively.

