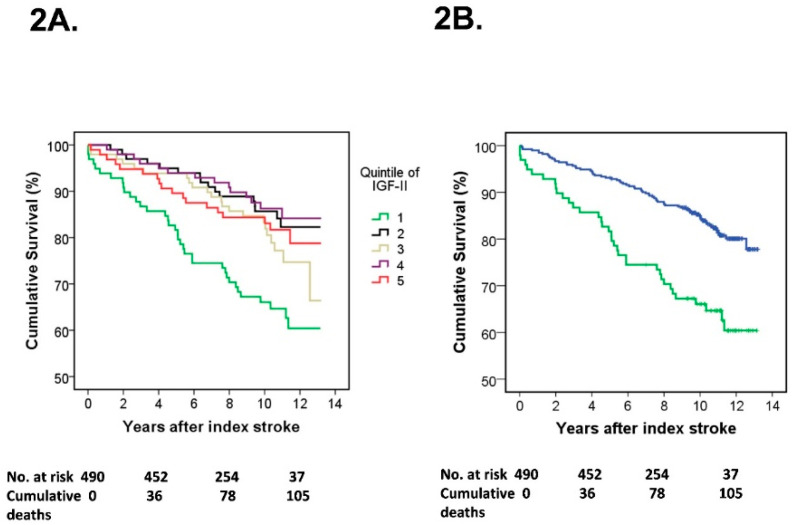
Figure 2.
Low s-IGF-II in the acute phase of ischemic stroke (IS) is associated with increased risk of mortality. Kaplan–Meier survival curves for the risk of all-cause mortality are shown for (A) all individual quintiles of acute s-IGF-II in the total IS cohort, and (B) the lowest quintile of acute s-IGF-II (quintile 1) and the merged group of the four higher acute s-IGF-II quintiles (quintiles 2–5) in the total IS cohort. Vertical markers within the lines represent censored data. In (A), the individual quintiles of acute s-IGF-II are shown in the colors specified in the panel. In (B), quintile 1 of acute s-IGF-II is displayed as a green line and the merged quintiles 2–5 of acute s-IGF-II as a blue line. Numbers at risk and cumulative mortality are presented at the index stroke and after 4, 8, and 12 years post-stroke. Panel A: log-rank tests: p = 0.001 quintile 1 vs. quintile 2; p = 0.025 quintile 1 vs. quintile 3; p < 0.001 quintile 1 vs. quintile 4; and p = 0.06 quintile 1 vs. quintile 5. Panel B: log-rank test: p < 0.001 quintile 1 vs. the merged quintiles 2–5.

