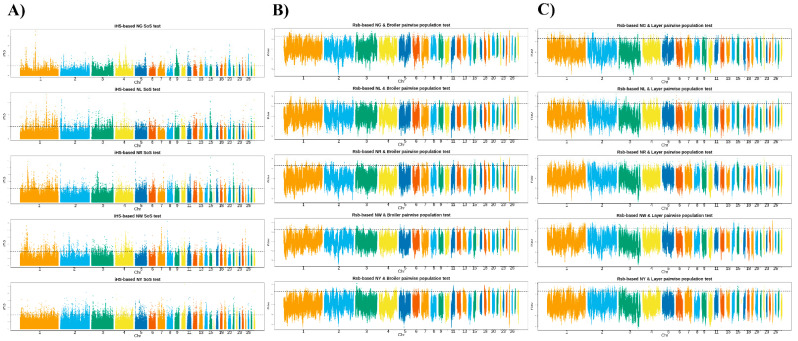
Figure 4.
Results of comparative selection signal analysis between commercial chickens (broilers and layers) and KNCs based on the extended haplotype homozygosity ratio between populations (Rsb) and the integrated haplotype homozygosity score (iHS). (A) Regions in the KNC population exhibiting selection signals based on the iHS. (B) Pairwise Rsb indicating selection signals in the KNC population vs. the broiler population. (C) Pairwise Rsb indicating selection signals in the KNC population vs. the layer population. Black lines indicate threshold at p < 0.01.

