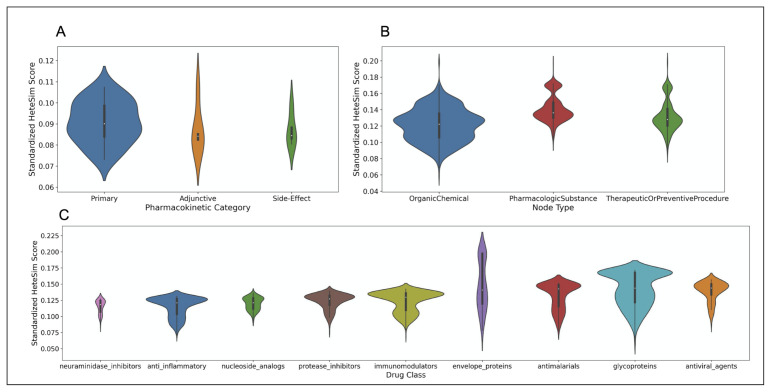
Figure 10.
(A) Violin plot showing the distribution of standardized HeteSim scores between each pharmacokinetic label. Lower HeteSim score means a closer relationship between the source node and tail node. (B) Violin plot showing the distribution of standardized HeteSim scores between each node type. (C) Violin plot showing the distribution of standardized HeteSim scores between each drug class.

