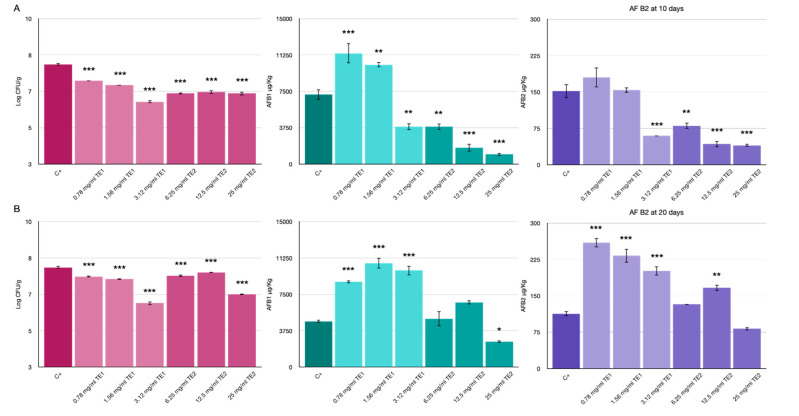
Figure 8.
Effects of TE1 and TE2 on the growth of Aspergillus flavus in maize. Results expressed as microbiological count (log10 CFU/g) and AFs concentration detected (µg/kg) at 10 days (A) and 20 days (B). Statistically significant differences for each treatment are indicated by * p < 0.05, ** p < 0.01, *** p < 0.001. Results are expressed as mean ± standard error.

