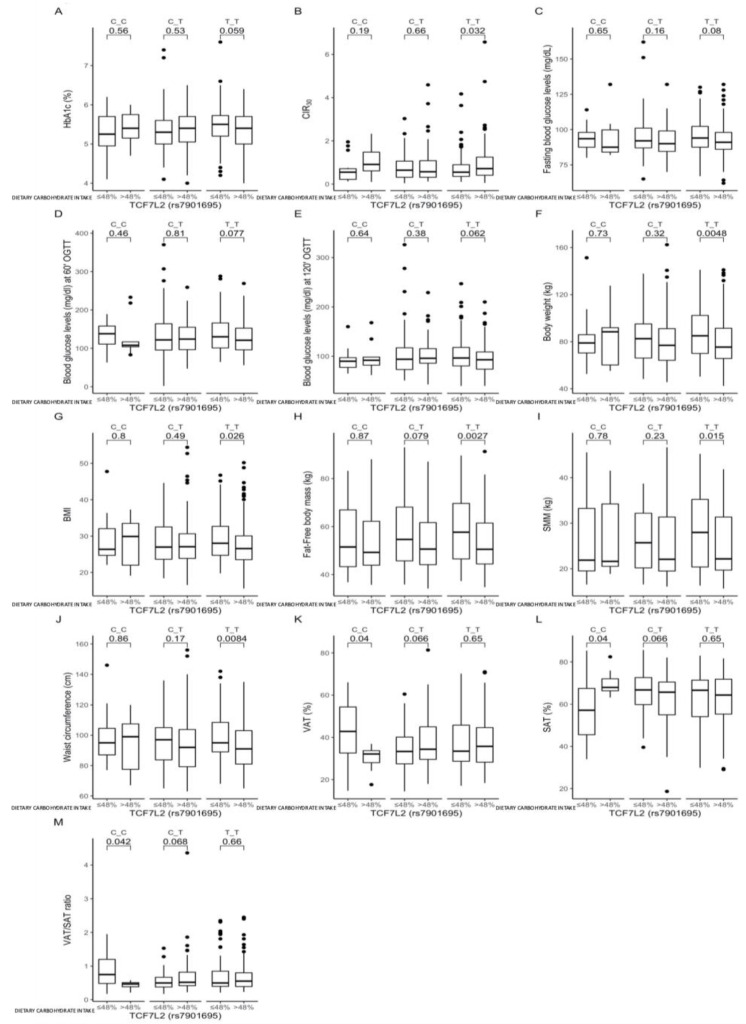
Figure 4.
Association of dietary carbohydrate intakes ≤48% and >48% of total daily energy intake with (A) HbA1c, (B) CIR30, (C) fasting blood glucose levels (mg/dL), (D) blood glucose levels at 60 min of OGTT (mg/dL), (E) blood glucose levels at 120 min of OGTT (mg/dL), (F) body weight (kg), (G) BMI (kg/m2), (H) FFM (kg), (I) SMM (kg), (J) waist circumference (cm), (K) VAT (%), (L) SAT (%), and (M) VAT/SAT ratio, in the TCF7L2 rs7901695 genotype carriers. The differences in median values of the selected responses and the interquartile ranges (IQRs) in different genotypic and dietary strata are presented.

