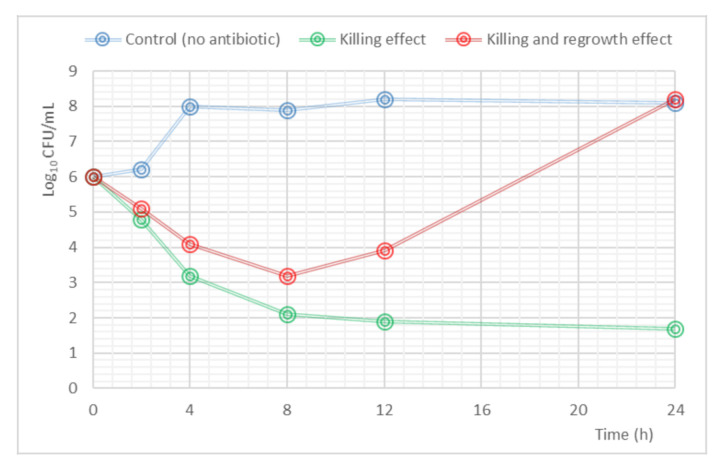
Figure 3.
Example of a time-kill curve. The blue line shows the evolution of the initial inoculum in the absence of antibiotic (control); the green line represents the reduction in the bacterial count in the presence of antibiotic (killing effect); the red line explains the behavior in the bacterial load when a regrowth effect appears.

