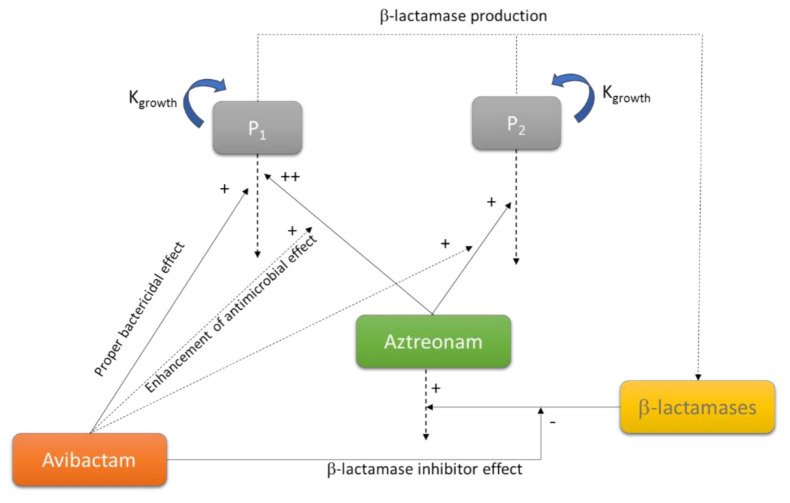
Figure 5.
Schematic representation of a model used to characterize the aztreonam-avibactam killing effect on drug susceptible (P1) and less susceptible (P2) bacteria. Adapted from [47]; Published by the American Society for Clinical Pharmacology and Therapeutics, 2019.

