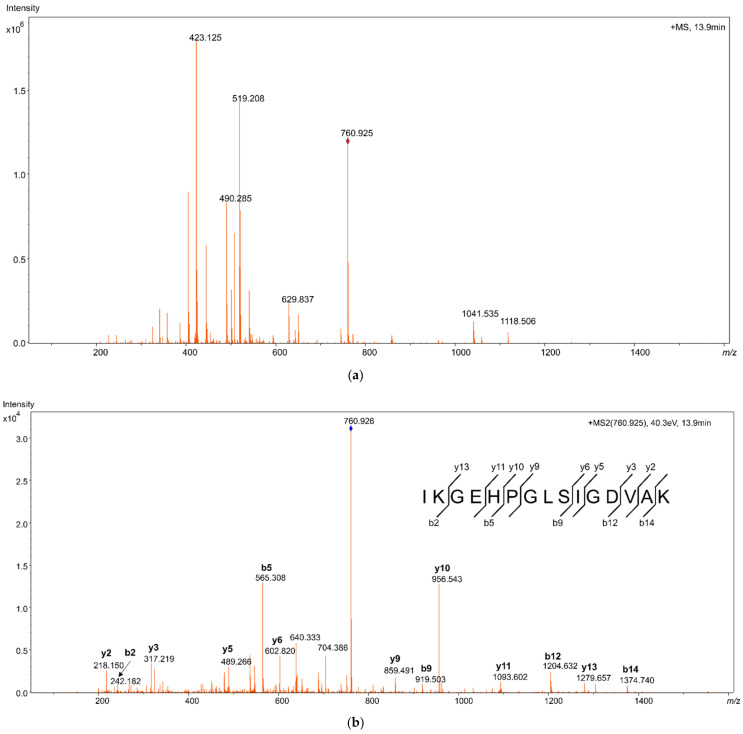
Figure 2.
Mass spectrum from high resolution mass spectrometry (HRMS), identifying high mobility group box 1 (HMGB1) peptide IKGEHPGLSIGDVAK (a) Molecular ion mass spectrum showing the peptide mass [M + 2H]2+ with m/z 760.9245, at 13.9 min. (b) Fragment ion mass spectrum of m/z 760.9245 showing series of y- and b-ions identifying the amino acid sequence.

