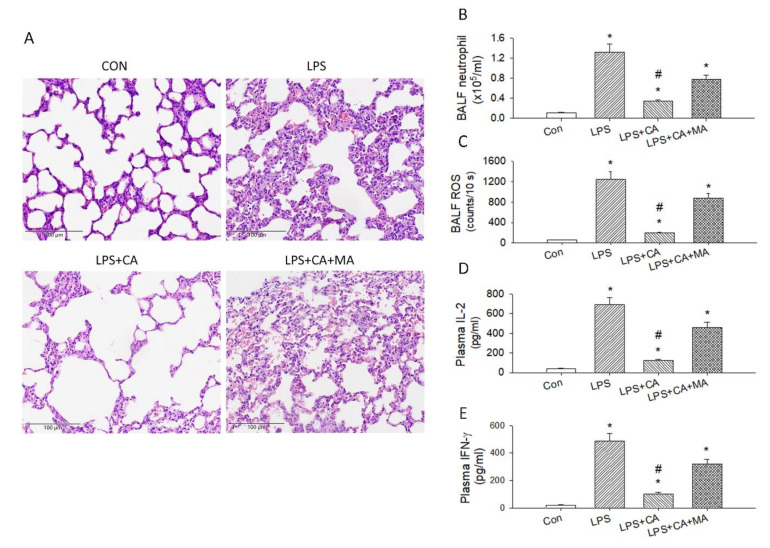
Figure 8.
Catechins treatment reduced LPS-induced ALI. (A) H&E staining of the lung in the four groups of mice. (B) Analysis of neutrophils in the BALF of four groups (n = 6). (C) The ROS amount in the BALF of these four groups (n = 6). The concentration of plasma IL-2 (D) and IFN-γ (E) of these four groups (n = 6); * p < 0.05 vs. Con. # p < 0.05 vs. LPS.

