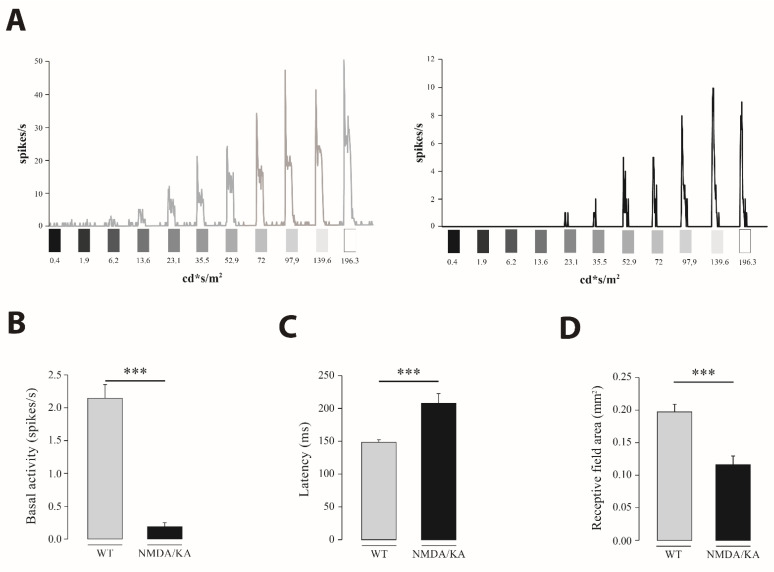
Figure 5.
Functional characterization of RGC in the control and injured group. (A). Examples of light responses recorded from RGC to increasing light intensities of an ON-type cell from the control (left) and NMDA/KA (right) retinas. The left post stimulus time histogram (PSTH) corresponds to an RGC from the control retina, which increases the firing rate as the light intensity increases, being sensitive to 6.2 cd·s/m2 intensity. However, on the right, RGC from the NMDA/KA injected eyes needs brighter light intensities to evoke light responses. A wide reduction in firing frequency in the RGC from injured retina is also noted. (B). Differences in the spontaneous basal activity recorded from the RGC in control and NMDA/KA injected eyes. A statistically significant difference is observed between both animal groups (Mann–Whitney U; p ≤ 0.001). (C). Histogram representation of the mean latency of the ON and ON/OFF cell types (only the ON phase) for the control group (n = 202) and just the ON type in the NMDA/KA injected group (n = 48), showing statistically significant differences (Mann–Whitney U; p ≤ 0.001). (D). Comparison of the receptive field size of RGC in the control and NMDA/KA injected retinas. A statistically significant decrease was observed in the NMDA/KA when compared with the control retinas (Mann–Whitney U; p ≤ 0.001). The receptive field size is measured by drawing the matrix obtained by multiplying the response after light bars stimulation in two orthogonal directions for each cell in Image J. Data are presented as mean ± SEM. (***, p ≤ 0.001).

