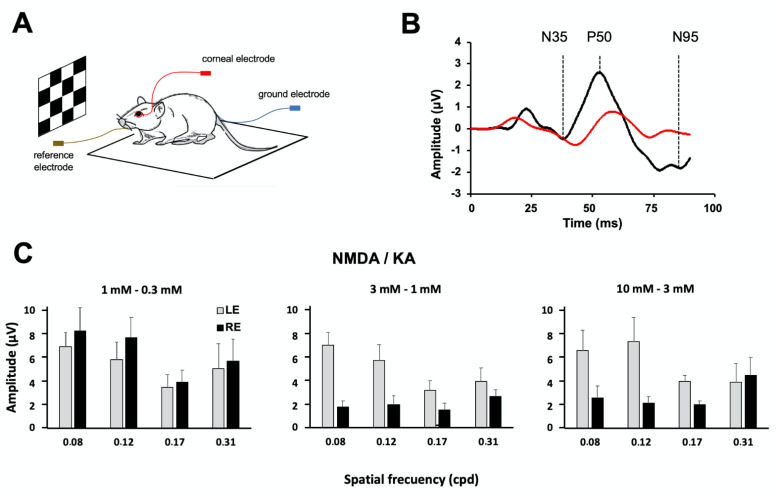
Figure 7.
Effect of NMDA/KA injection on retinal ganglion cell functionality evaluated by pattern electroretinography (pERG). (A). Schematic diagram of the pERG test experimental design (B). Example of the pERG trace recorded before the injection of 10:3 mM NMDA/KA (black line) and one week after the injection (red line). Before injection, the trace recording shows the three characteristic components of the pERG (N35, P50, and N95). However, one week after the injection, just the P50 component is clearly distinguished. (C). Histogram representations of the N95 pERG component amplitude, averaged (mean ± SD) from the right eye (RE) and the left eye (LE) at different spatial frequencies. The right eyes of the animals are injected with NMDA/KA at 1:0.3 mM (n = 7), 3:1 mM (n = 7) and 10:3 mM (n = 4). The control left eyes are injected with PBS. A statistically significant decrease in the N95 amplitude is observed after eye injection with 3:1 mM and 10:3 mM NMDA/KA (p < 0.05, two way ANOVA).

