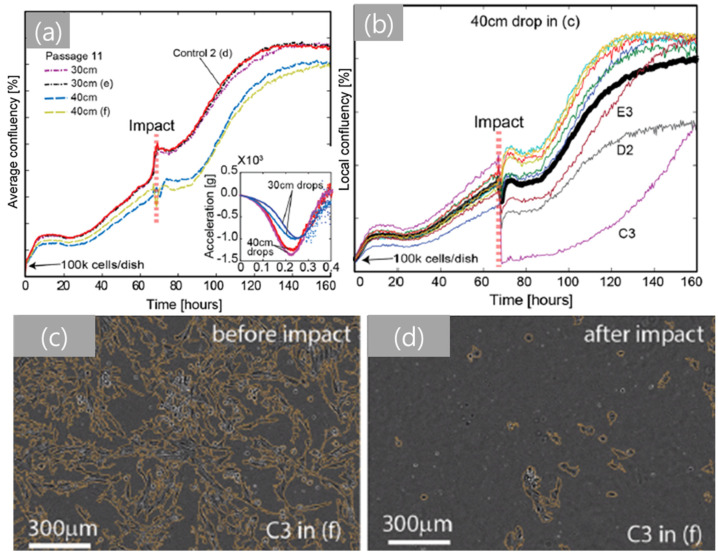
Figure 5.
Characterization of cell injury depending on drop height using Hs27 fibroblasts (x-axis: time and y-axis: average confluency). (a) The average confluency graph for 30 and 40 cm drops. (b) The local confluency graph for 40 cm drop. (c,d) Live cell images during 40 cm drop (c) before and (d) after impact [146].

