Figure 1.
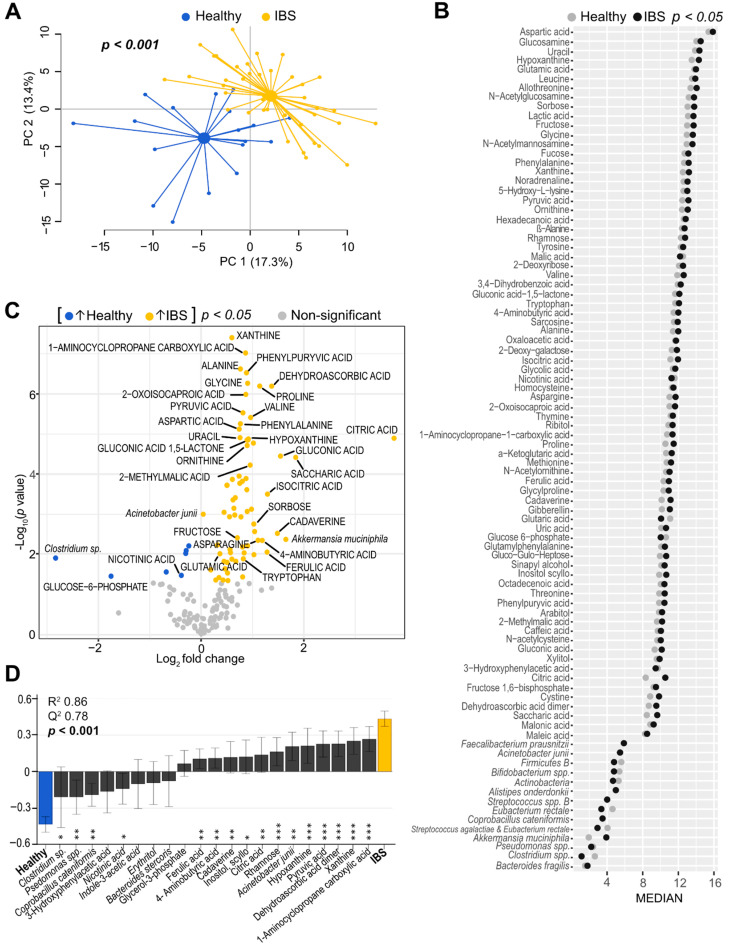
Faecal microbiota and metabolite profiles of IBS patients and healthy subjects. (A) Principal component analysis (PCA) score scatter plot based on faecal bacteria and metabolites showing IBS patients (n = 40, yellow dots) and healthy subjects (n = 18, blue dots). The p value depicts statistical significance of the distance between centroids (scores average) of the groups. (B) Cleveland dot plot depicting the differentiating microbiota and metabolite variables (p < 0.05) between IBS patients and healthy subjects. The horizontal axis represents bacterial probe intensity (n = 14) and metabolite signal intensity (n = 76) values and the vertical axis shows the variable IDs. Log-transformed median values for each X-variable are depicted for the IBS group (black dots) and healthy group (grey dots), respectively. Mann–Whitney U test was performed to evaluate differences between the groups. (C) Volcano plot illustrating mean fold change vs. statistical significance based on 54 bacteria (probe intensity) and 155 metabolites (signal intensity) in IBS patients vs. healthy subjects (IBS/H). Each dot corresponds to a bacterial probe or metabolite signal. Variables increased in IBS are coloured in yellow (n = 70), while decreased variables compared to healthy subjects are coloured in blue (n = 7). Mean fold change is shown as log2. p values are shown as –log10; p value < 0.05 are coloured; non-significant p values are shown in grey. Student’s t-test was used to identify differences between the groups. For visual clarity, only some bacteria and metabolites with log2 (IBS/H) < −1 and >+1 and p values < 0.05 are labelled. (D) Orthogonal partial least squares-discriminant analysis (OPLS-DA) loading column plot based on the discriminatory bacterial taxa (n = 5) and metabolites (n = 16), selected after the least absolute selection and shrinkage operator (LASSO) method with regularization, between IBS patients and healthy subjects. The R2 value indicates goodness of the fit; the Q2 value expresses prediction ability. The p value depicts statistical significance based on the cross-validated residuals (CV-ANOVA) test. Error bars indicate 95% confidence intervals. Asterisks represent significant p-values: * < 0.05; ** < 0.01; *** < 0.001.

