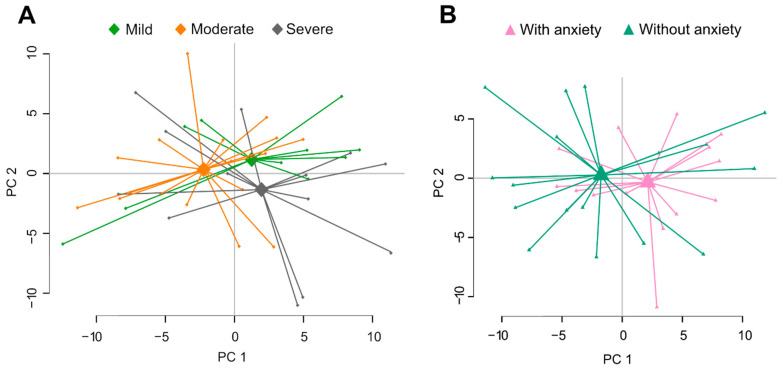
Figure 3.
Faecal microbiota and metabolite profiles of IBS patients classified according to symptoms. (A) Principal component analysis (PCA) score scatter plot based on faecal bacteria and metabolites showing patients with mild (n = 15, light green), moderate (n = 18, orange) and severe (n = 7, grey) IBS symptoms (IBS-SSS). (B) PCA score scatter plot based on faecal bacteria and metabolites showing IBS patients with (n = 17, pink) and without anxiety (n = 14, teal) (based on validated cut-off levels on HAD-A, ≥8).

