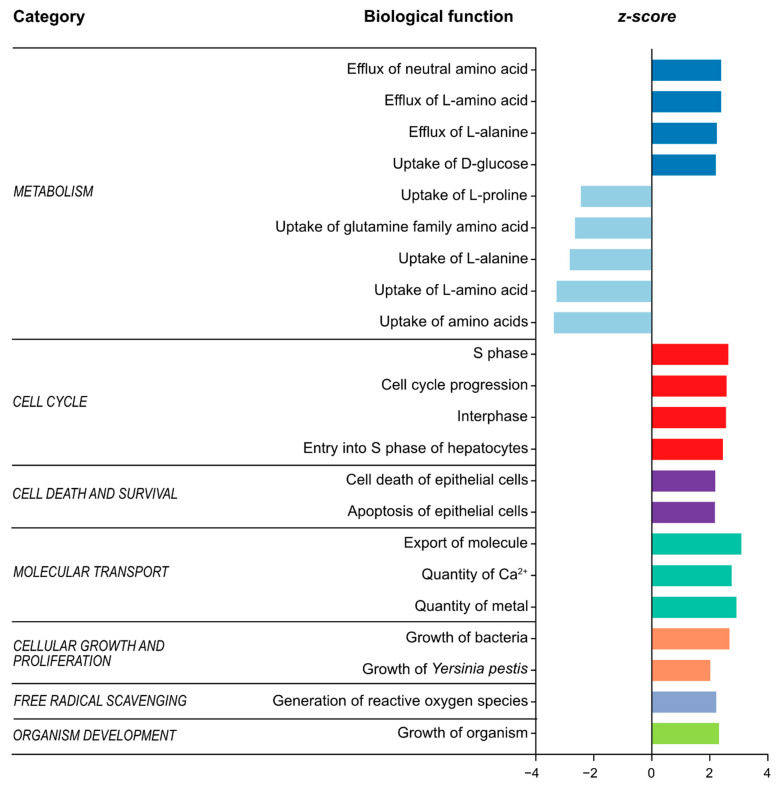
Figure 4.
Significantly enriched biological functions predicted to be associated with changes in metabolites in patients with IBS compared to healthy subjects. The bar plot represents 22 biological functions predicted to be altered in IBS patients with significant activation Z-score > 2 or < −2 identified by IPA core analysis. Z-scores > 2 or < −2 indicate predicted decrease or increase, respectively. The analysis used a total of 35 metabolites (p value < 0.05). Each bar denotes a different biological function where each colour corresponds to a simplified category.

