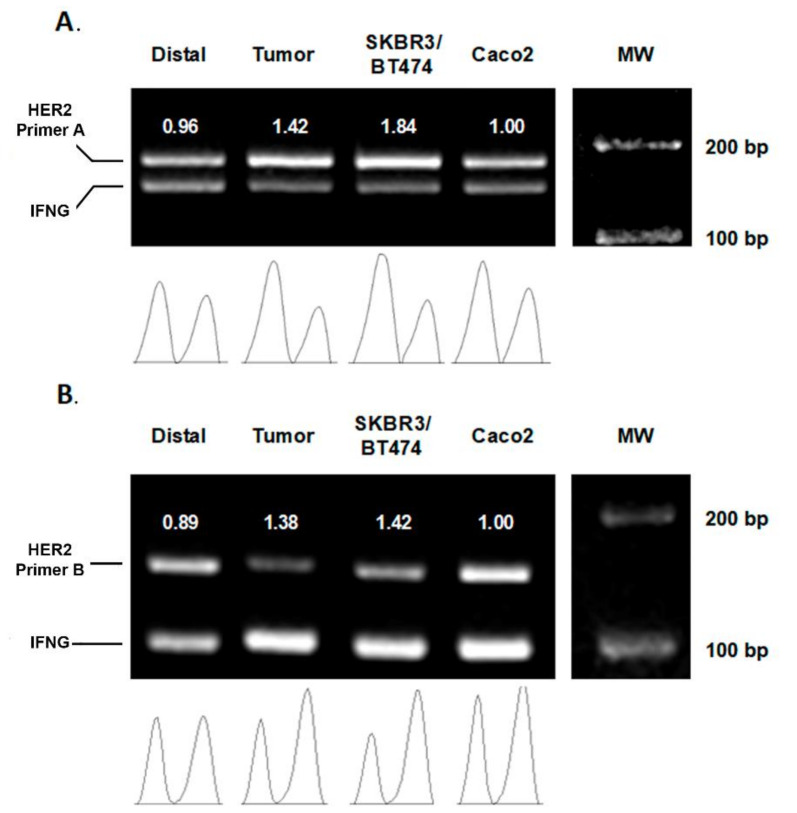
Figure 1.
Representative agarose gel of diffPCR amplifications. (A) HER2 primers A (180 bp) and IFNG primers (150 bp), (B) IFNG primers (150 bp) and HER2 primers B (98 bp). Each PCR performed during the experiments included the amplification of paired samples (distal and tumor), a positive control (SKBR3 and BT474 DNA) and the negative control (Caco-2). Density graphs were quantified and relativized to Caco-2. The values below the bands correspond to the HER2/IFN-γ ratio. The results confirm that both PCR methodologies are suitable to detect HER2 amplification in patients with gastric adenocarcinoma. The full figure please see Figure S1.

