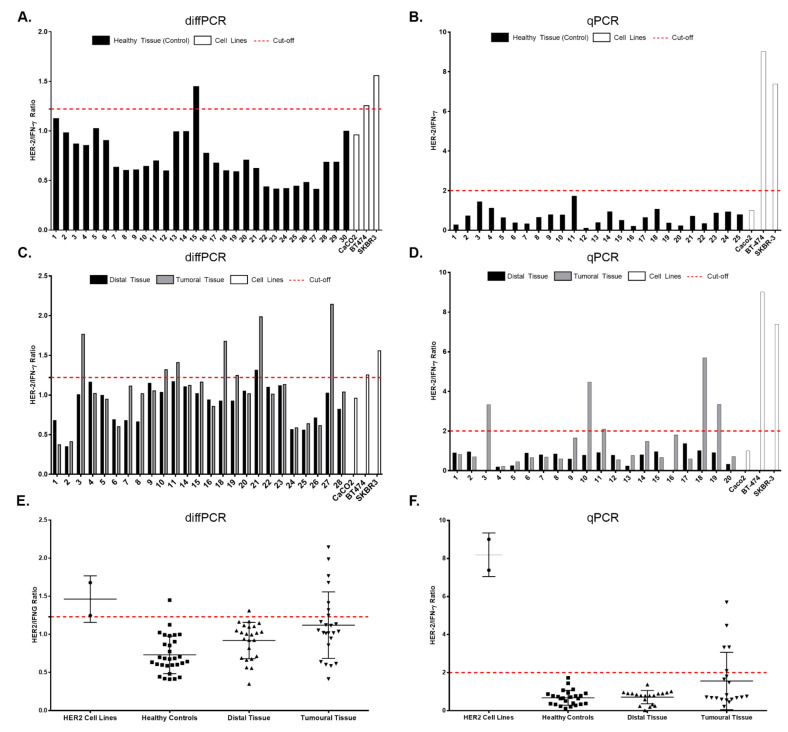
Figure 2.
Quantification of HER2 amplification by diffPCR and qPCR. (A) diffPCR results obtained from 30 healthy control samples. All samples, except 15, are below the cut-off point (1.22) (B) qPCR results obtained from 30 healthy control samples. All samples are below the cut-off point (1.85). (C) diffPCR results obtained from paired samples (tumor and distal) from patients with gastric cancer. (D) qPCR results obtained from paired samples. Consistent results were obtained in patients 3, 10, 11, 18 and 19, being positive by both methodologies. (E) Graph show diffPCR results in paired samples from patients (tumoral and distal), healthy subjects and positive cell lines. (F) Graph show qPCR results in paired samples from patients (tumoral and distal), healthy subjects and positive cell lines.

