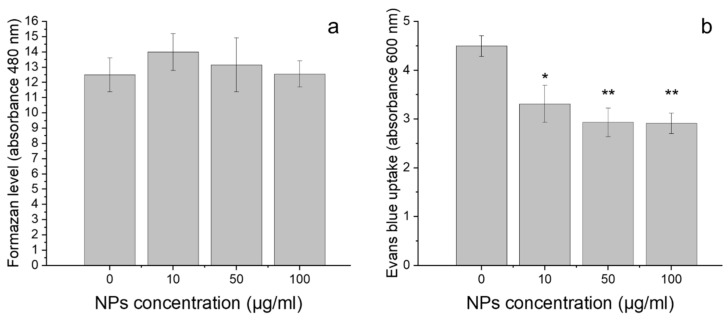
Figure 4.
Cell viability of wheat exposed for 3 days to GdVO4:Eu3+ NPs at concentrations: 0, 10, 50 and 100 µg/mL, determined by TTC (a) and Blue Evans (b) staining assays. Asterisks (*) indicate statistically significant differences between the samples exposed to NPs and the control, Tukey’s test (* p < 0.05 level, ** p < 0.01 level). The results are presented as mean ± SE.

