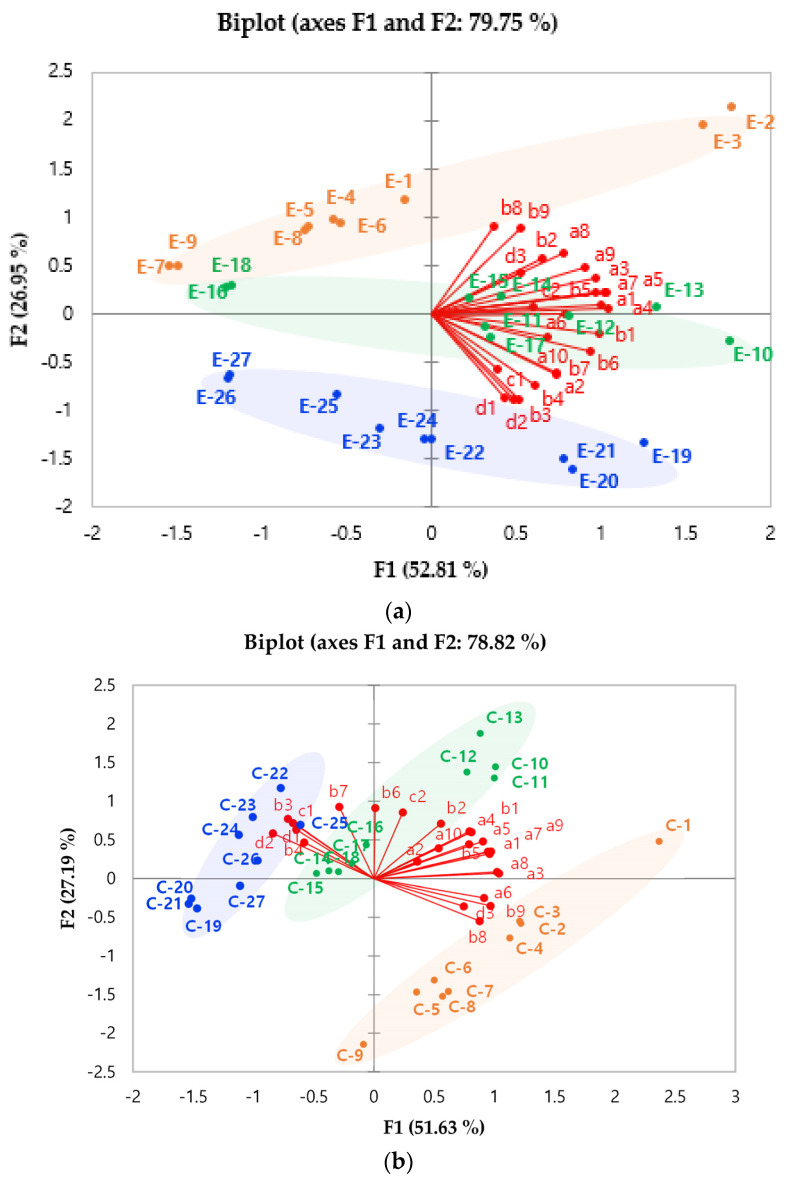
Figure 2.
Principal component analysis (PCA) biplot of volatile compounds (a) in espresso coffee, (b) cold brew coffee. The relative location of volatile compounds in espresso and cold brew coffee roasted at 240 °C for 15 min. (a1: 2-methylpyrazine, a2: 2,3-dimethylpyrazine, a3: 2,5-dimethylpyrazine, a4: 2,6-dimethylpyrazine, a5: 2-ethylpyrazine, a6: 2,6-diethylpyrazine, a7: 2-ethyl-3-methylpyrazine, a8: 2-ethyl-5-methylpyrazine, a9: 3-ethyl-2,5-dimethylpyrazine, a10: isopropenyl pyrazine, b1: 2-acetylfuran, b2: 2,2′-bifuran, b3: 2,2′-methylenebisfuran, b4: 2,2′-[oxybis(methylene)]bisfuran, b5: furfuryl alcohol, b6: furfuryl acetate, b7: furfuryl propionate, b8: furfural, b9: 5-methylfurfural, c1: 1-methylpyrrole, c2: 1-furfurylpyrrole, d1: guaiacol, d2: 4-ethylguaiacol, d3: 2-methoxy-4-vinylphenol.). E and C mean extraction method of expresso and cold brew, respectively. According to the roasting conditions, sample numbers were divided into 1 to 9 (235 °C for 13 min), 10–18 (240 °C for 15 min), and 19–27 (245 °C for 17 min). The sample number was also assigned to the particle size of grounded coffee (355 μm: 1–3, 10–12, 19–21; 500 μm: 4–6, 13–15, 22–24; 710 μm: 7–9, 16–18, 25–27). The sample number assigned according to the size of the coffee bean was divided into three equal parts according to the type of water (filtered water: 1, 4, 7, 10, 13, 16, 19, 22, 25; tap water: 2, 5, 8, 11, 14, 17, 20, 23, 26; bottled water: 3, 6, 9, 12, 15, 18, 21, 24, 27).

