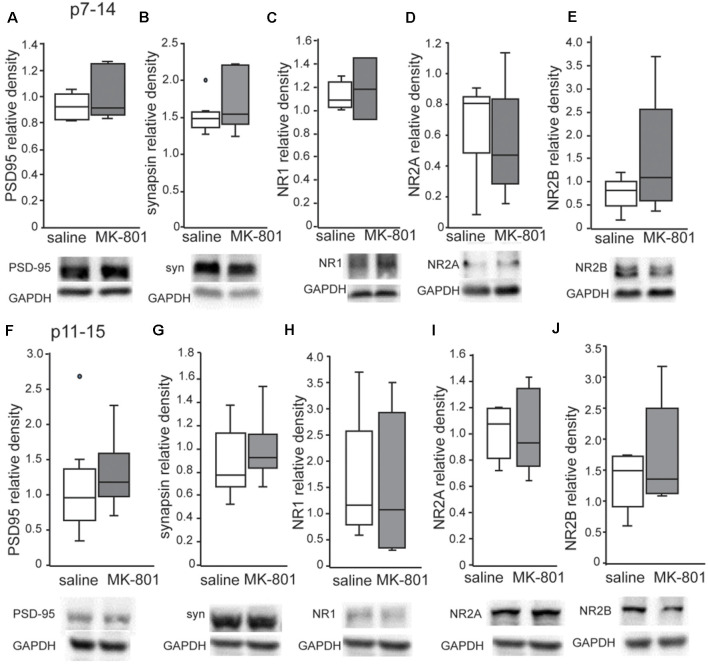
Figure 6.
Expression of PSD-95, synapsin, NR1, NR2A and NR2B in the HPC of nMK-801 (p7–14; n = 6) and nMK-801 (p11–15; n = 6) compared to saline-treated controls (n = 6 + 6, 12 total). (A) No differences are identified in the PSD95 relative density in the HPC of nMK-801 (p7–14) compared to saline-treated (t-test, p = 0.4). (B) No differences are identified in the synapsin relative density in the HPC of nMK-801 (p7–14) compared to saline-treated (t-test, p = 0.4). (C) No differences are identified in the NR1 relative density in the HPC of nMK-801 (p7–14) compared to saline-treated (t-test, p = 0.6). (D) No differences are identified in the NR2A relative density in the HPC of nMK-801 (p7–14) compared to saline-treated (t-test, p = 0.5). (E) No differences are identified in the NR2B relative density in the HPC of nMK-801 (p7–14) compared to saline-treated (t-test, p = 0.2). (F) No differences are identified in the PSD95 relative density in the HPC of nMK-801 (p11–15) compared to saline-treated (t-test, p = 0.7). (G) No differences are identified in the synapsin relative density in the HPC of nMK-801(p11–15) compared to saline-treated (t-test, p = 0.3). (H) No differences are identified in the NR1 relative density in the HPC of nMK-801 (p11–15) compared to saline-treated (t-test, p = 0.75). (I) No differences are identified in the NR2A relative density in the HPC of nMK-801 (p11–15) compared to saline-treated (t-test, p = 0.9). (J) No differences are identified in the NR2B relative density in the HPC of nMK-801 (p11–15) compared to saline-treated (t-test, p = 0.2).

