Figure 7.
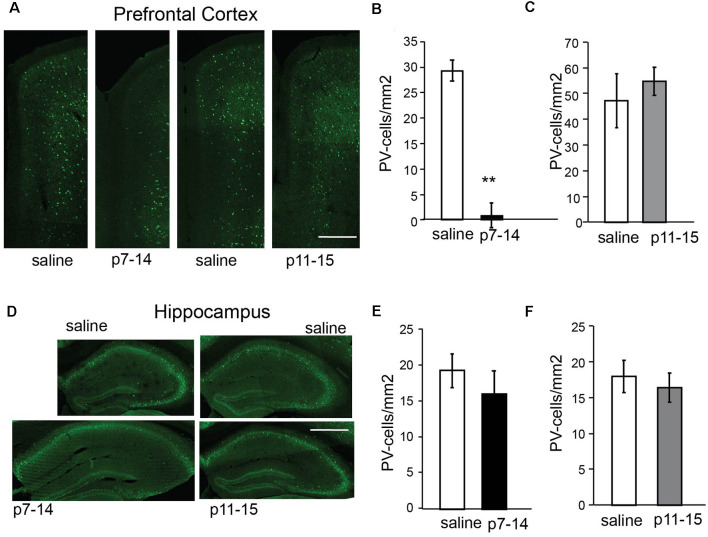
Number of PV-expressing cells in the PFC and HPC of nMK-801 (p7–14; n = 3) and nMK-801 (p11–15; n = 3) compared to saline-treated controls (n = 6 total, pooled from both p7–14 and p11–15 groups). (A–C) Representative images (scale bar: 0.5 mm) (A) and graphs showing that the number of PV-expressing cells is reduced in the PFC of nMK-801 (p7–14)-treated mice are reduced compared to their saline controls (t-test, p = 0.002) (B), while the number of PV-expressing cells in the nMK-801 (p11–15)-treated mice is not affected compared to saline-treated controls (t-test, p = 0.3) (C). (D–F) Representative images (scale bar: 1 mm) (D) and graphs showing that the number of PV-expressing cells is not different in the HPC of nMK-801 (p7–14)-treated mice compared to their saline controls (t-test, p = 0.5) (E), or the HPC of nMK-801 (p11–15)-treated mice compared to saline-treated controls (t-test, p = 0.2) (F). **p < 0.01.

