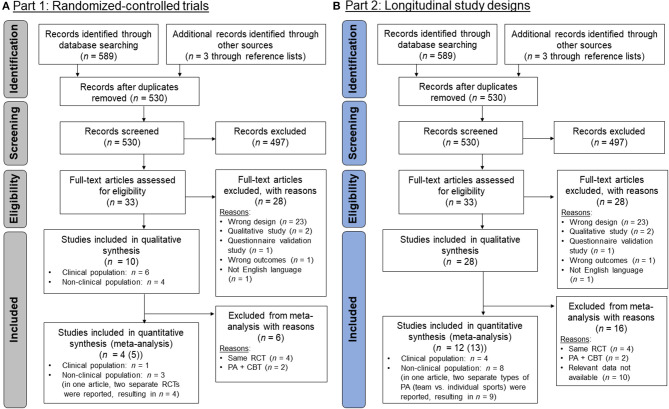
Figure 1.
PRISMA flow-chart diagrams (Moher et al., 2009): (A) Studies with a randomized-controlled trial (RCT) design (part 1); (B) studies with a longitudinal design (part 2). The RCTs that were found in (A) were also included in (B). The steps until inclusion were the same part 1 and 2 until the screening process and, therefore, the numbers are equal.

