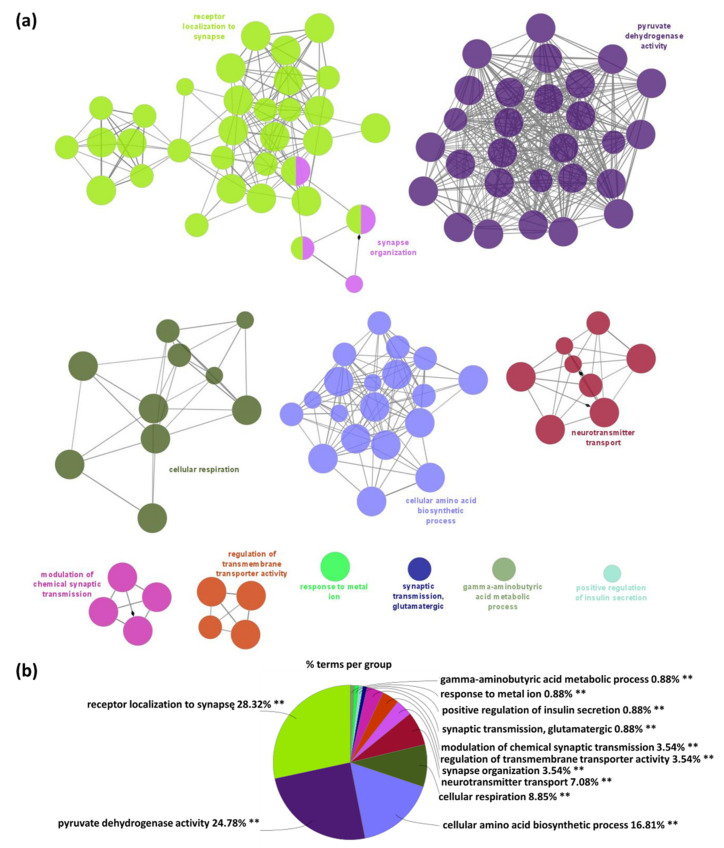
Figure 3.
Functional enrichment analysis of proteins specific for female WT mice using the Gene Ontology biological processes database and the Clue Go algorithm. (a) Network depicting interactions between enriched functional classes. Each circle represents a biological term consisting of various related proteins/genes. Terms that belong to the same pathway are shown with the same color, and terms associated with two different pathways are marked with two colors. The size of the circles relates to the statistical significance of the term enrichment. The connectivity (edges) between the terms in the network is derived from kappa score, (indicates the similarity of associated genes shared by different terms). Thicker edges indicate stronger similarity. Diamonds represent directed edges which link parent terms to child terms. Only the name of the most significant term in each group is shown to reduce overlay. (b) A diagram showing the percentage of terms per group of enriched protein classes.

