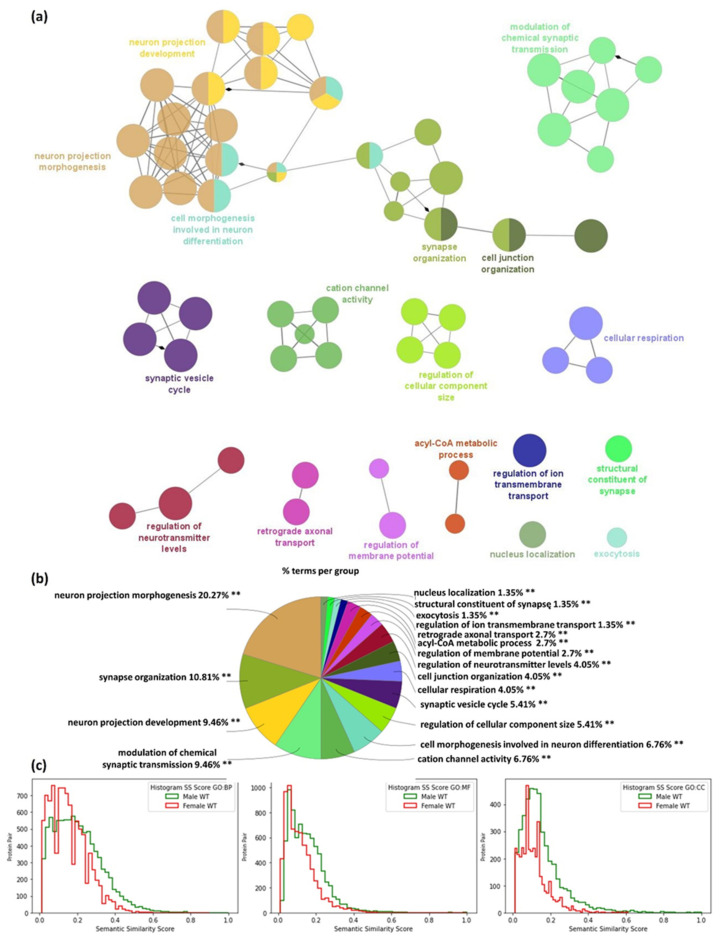
Figure 4.
Functional enrichment analysis of proteins specific for male WT mice using the Gene Ontology biological processes database and the Clue Go algorithm. (a) Network depicting interactions between enriched functional classes. (b) A diagram showing the percentage of terms per group analysis of enriched protein classes. (c) Comparison of semantic similarity (SS) of protein pairs from male and female WT mice for each type of Gene Ontology term: cellular components (CC), molecular functions (MF) and biological processes (BP), respectively. The X-axis represents the SS score (ranges—0, 1) and the Y-axis represents the frequency of protein pairs.

