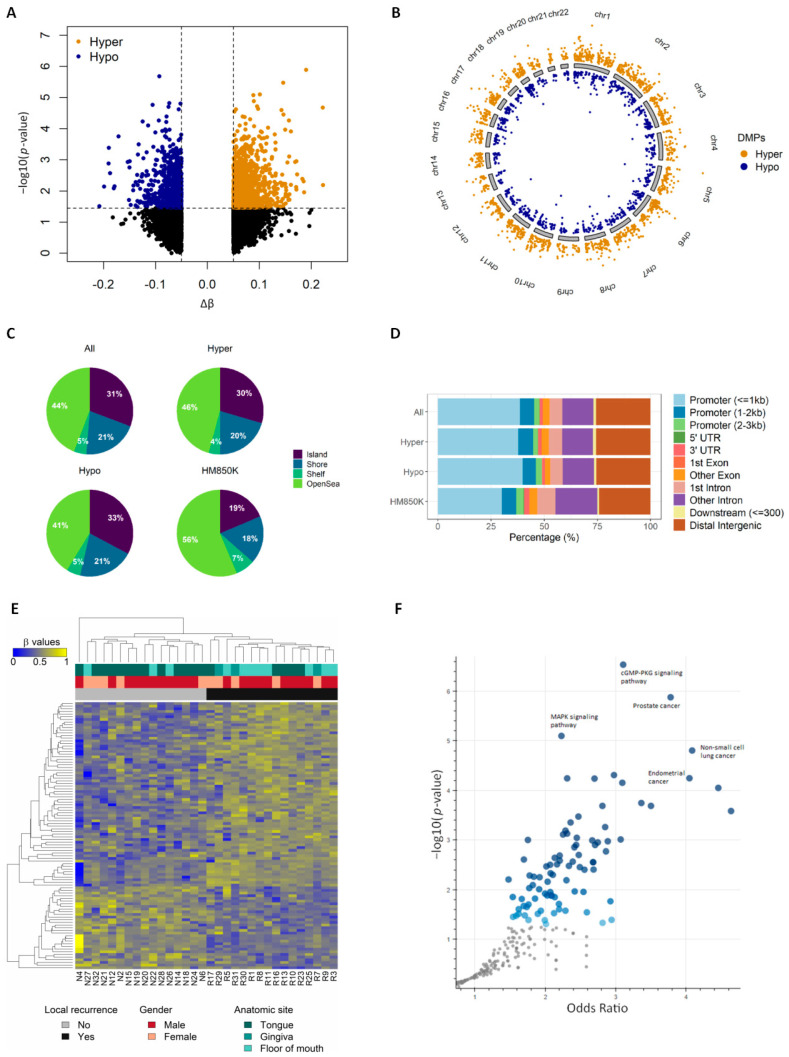
Figure 2.
Identifying tumor-specific DMPs (5% Δβ) across the genome. (A) volcano plot showing hyper and hypo methylated CpGs between recurrent and non-recurrent cases. The x-axis representing the differential methylation between the groups is plotted against the statistical significance of each probe analyzed. Hypermethylated probes with adjusted p-value > 0.1 and Δβ ≥ 0.5 are represented in orange, while hypomethylated probes with adjusted p-value > 0.1 and Δβ ≤ −0.5 are represented in blue; (B) genome-wide DNA methylation profile of patients that developed local recurrence, by chromosome. Orange dots represent hypermethylated probes, blue dots represent hypomethylated probes; (C) CpG context of the identified DMPs in CpG islands, shores, shelves, and open sea. All (n = 2512), hypermethylated (n = 1594) and hypomethylated (n = 918) DMPs are compared with the HM850K array (n ≅ 85,000); (D) genomic annotations of the identified DMPs in the human genome. Plot generated using ChIPseeker package; (E) heatmap showing the top 100 DMPs associated with local recurrence. CpG sites are clustered in the horizontal rows and samples are clustered in the vertical columns. High methylation levels are shown in yellow and low methylation levels in blue, according to the scale bar on the left; (F) volcano plot showing the significance of each gene set from the DMP-associated gene list versus its odds ratio. Each point represents a single gene set from a pathway, where the larger and darker blue color dots represent significant (p-value < 0.05) and smaller gray color dots represent non-significant enrichments.

