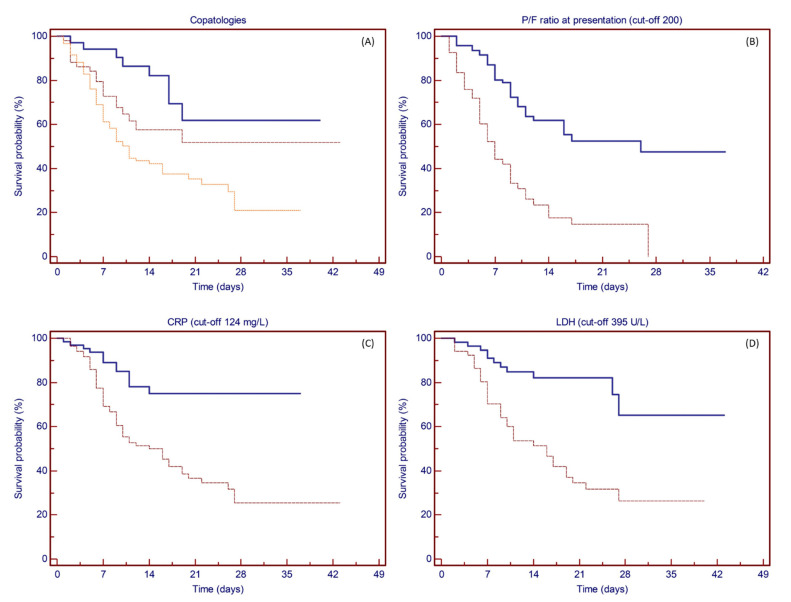
Figure 3.
Kaplan–Meier plots showing the probability of survival based on clinical variables. (A) Patients with no comorbidity (solid line), 1 comorbidity (dashed line), and 2 or more comorbidities (dotted line). The number of comorbidities showed prognostic significance for survival (p = 0.0008), with an estimated 28-day survival rate of 61.8%, 51.7%, and 35.3%, respectively. (B) P/F ratio at presentation more than 200 (solid line) or less than or equal to 200 (dashed line). P/F ratio at presentation showed prognostic significance for survival at a cut-off point set at 200 (p < 0.0001), with an estimated 21-day survival rate of 52.4% and 14.7%, respectively. (C) CRP less than 124 (solid line) or more than or equal to 124 (dashed line). CRP values showed prognostic significance for survival at a cut-off point set at 124 mg/L (p = 0.0001), with an estimated 28-day survival rate of 74.9% and 25.4%, respectively. (D) LDH less than 395 (solid line) or more than or equal to 395 (dashed line). LDH values showed prognostic significance for survival at a cut-off point set at 395 U/L (p = 0.0001), with an estimated 28-day survival rate of 65.3% and 26.4%, respectively.

