Figure 1.
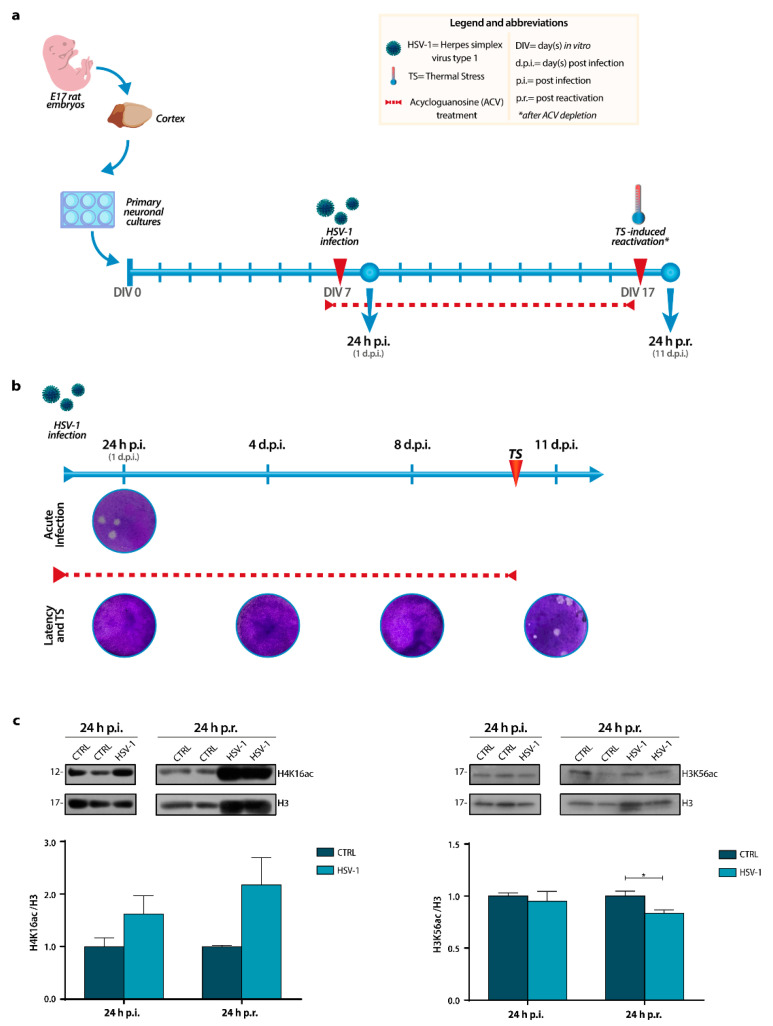
In vitro experimental model and histones acetylation levels during a recurrent HSV-1 infection in neurons. (a) Timeline of experimental procedures showing the days in culture of the neurons, the ACV treatment (red dashed line), the time of primary infection (DIV 7) and reactivation (DIV 17), and the time points chosen for the analyses: 24 h p.i. (DIV 8) and 24 h p.r. (DIV18). Abbreviations are shown in the yellow box. (b) Representative images of standard plaque assay (SPA) after primary infection (24 h p.i.) with or without ACV (Acute Infection and Latency and TS rows, respectively), during ACV-induced latency (4 and 8 d.p.i.) or after TS-induced reactivation (11 d.p.i.). (c) Representative immunoblots showing H4K16 and H3K56 acetylation levels in lysates from Mock- and HSV-1-infected neuronal cultures harvested 24 h p.i. or 24 h p.r.. H3 staining was used as a loading control. Densitometric analyses were performed with Quantity One software and normalized to H3 expression. The values represent the normalized fold-changes in acetylation levels from HSV-1 samples with respect to matched CTRL. Data are mean ± SEM. * p < 0.05. Statistical significance was calculated by the Mann–Whitney test.

