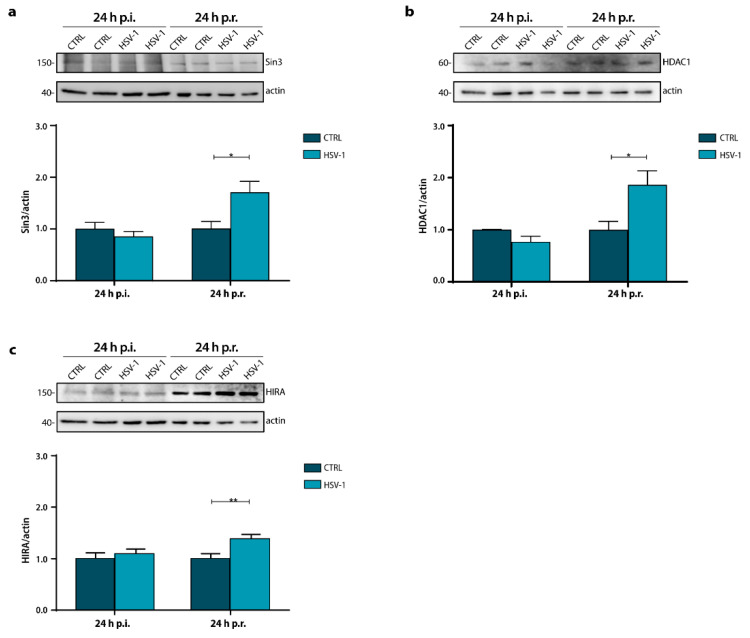
Figure 2.
Sin3, HDAC1 and HIRA expression during a recurrent HSV-1 infection in vitro. Representative immunoblots showing Sin3 (a), HDAC1 (b), and HIRA (c) protein levels in lysates from Mock- and HSV-1-infected neuronal cultures harvested 24 h p.i. or 24 h p.r. Actin staining was used as a loading control. Densitometric analyses were performed with ImageLab software and normalized to actin expression. The values represent the normalized fold-changes in protein levels from 24 h p.r. CTRL or HSV-1 samples with respect to 24 h p.i. CTRL. Data are mean ± SEM of three independent experiments. * p < 0.05; ** p < 0.01. Statistical significance was calculated by Mann–Whitney test.

