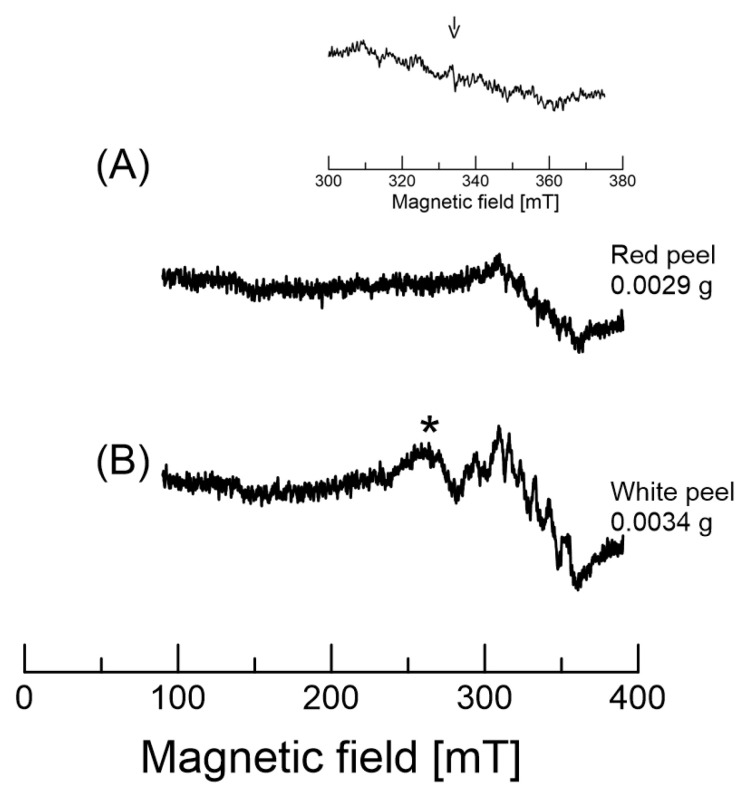
Figure 6.
EPR spectra obtained by a wide-range scan (300 mT) of the red and white peel of dragon fruits. (A) shows the EPR spectrum of the red peel. The upper figure shows the expansion of the 300 to 375 mT region. The arrow indicates the magnetic field at ~336 mT. (B) shows the EPR spectrum of the white peel. The arrow (~335 mT) indicates organic radicals. The asterisk is not known at this point.

