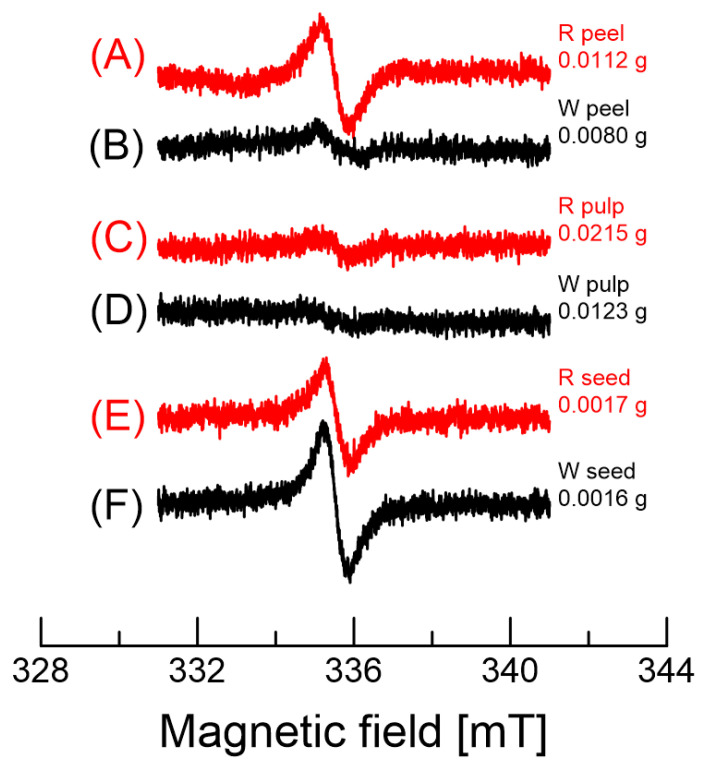
Figure 8.
EPR spectra of various parts of dragon fruits. (A,B) show the spectra of the peel of red and white dragon fruits, respectively. (C,D) show the spectra of the pulp of red and white dragon fruits, respectively. (E,F) show the spectra of the seeds of red and white dragon fruits, respectively. The sample weight measured is indicated at the right side of each spectrum.

