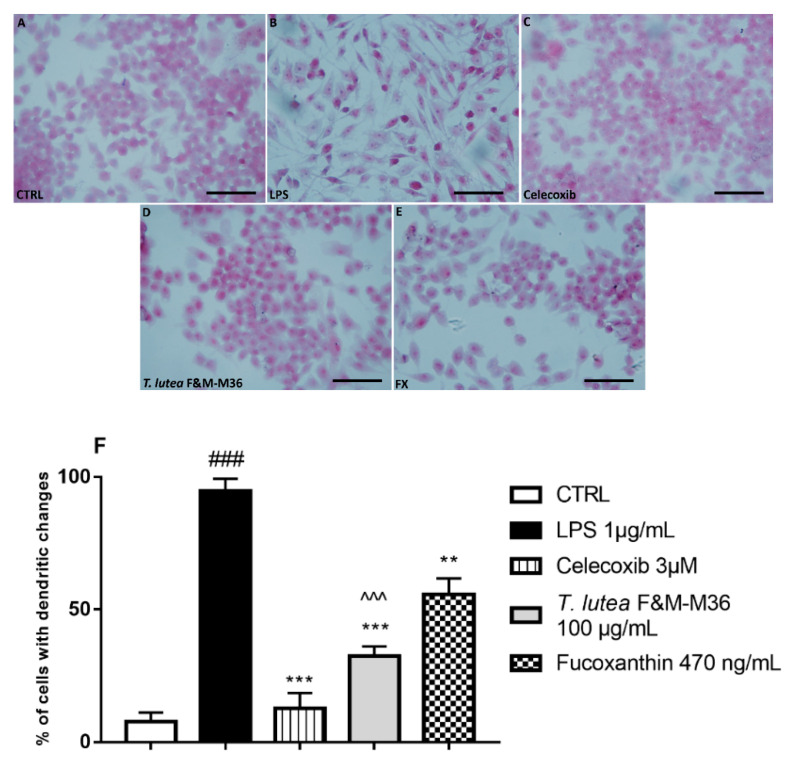
Figure 2.
Morphology images of RAW 264.7 cells in different groups obtained by a light microscope. Hematoxylin and eosin staining of cells from different experimental groups: (A) Unstimulated RAW264.7 cells; (B) LPS-stimulated RAW264.7 cells; (C) LPS-stimulated RAW264.7 cells treated with Celecoxib 3 µM; (D) LPS-stimulated RAW264.7 cells treated with T. lutea F&M-M36 extract 100 µg/mL; (E) LPS-stimulated RAW264.7 cells treated with FX 470 ng/mL; (F) Percentage of cells with dendritic changes. ### p < 0.001 vs. unstimulated RAW 264.7 macrophages (CTRL); ** p < 0.01 and *** p < 0.001 vs. LPS ^^^ p < 0.001 vs. FX by ANOVA test and Dunnett’s Multiple Comparison Test. Data are expressed as mean ± SEM of five replicates. Magnification = 400×; Scale bar = 20 μm.

