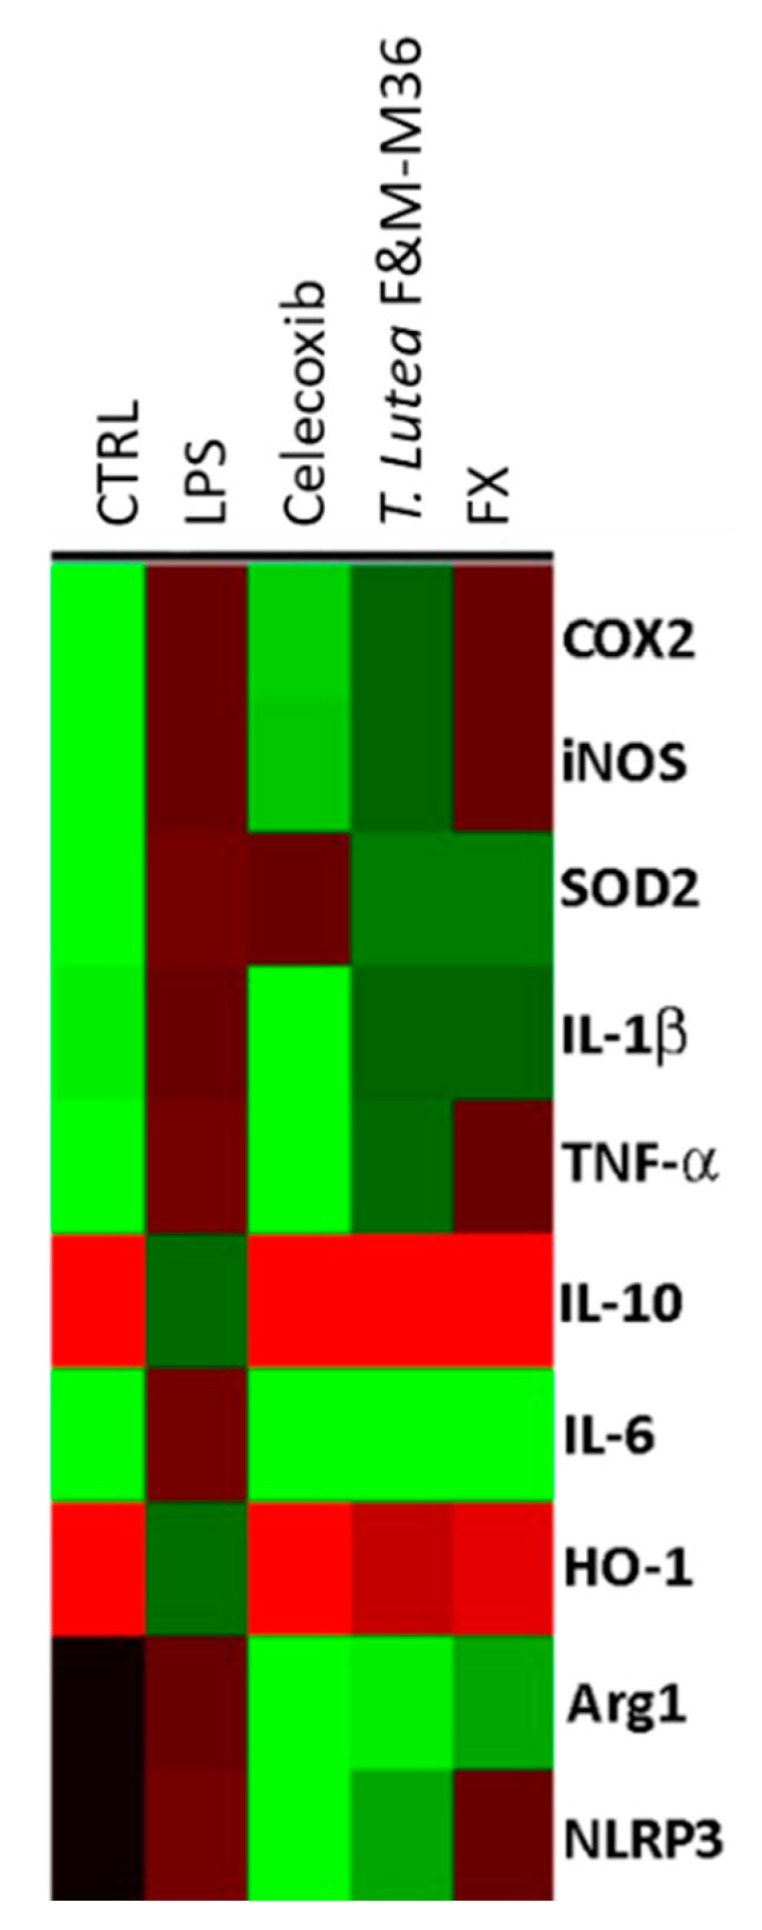
Figure 5.

Gene expression profiles of unstimulated RAW 264.7 macrophages (CTRL), RAW 264.7 macrophages stimulated with LPS and those treated with LPS in the presence of T. lutea F&M-M36 extract at 100 µg/mL and FX at 470 ng/mL. Each column represents a different treatment and each row a different gene; the color code indicates down-regulation (green) or up-regulation (red) compared to LPS.
