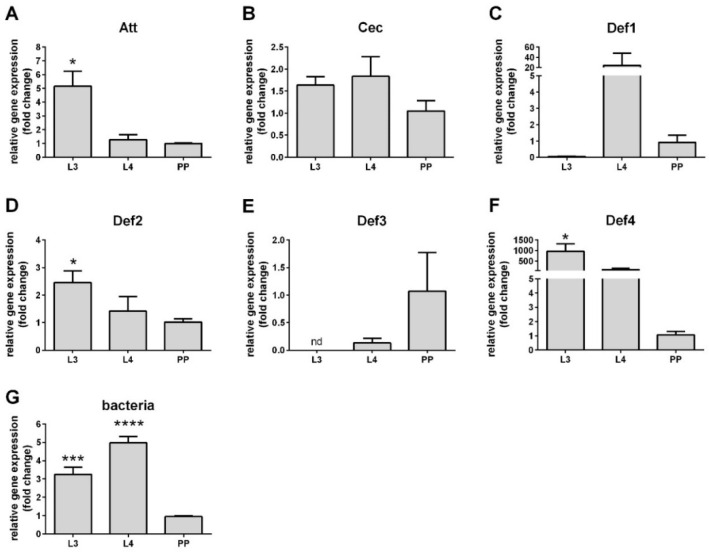
Figure 1.
Relative gene expression of antimicrobial peptides (AMPs) in larval stages. (A) attacin; (B) cecropin, (C) defensin 1; (D) defensin 2; (E) defensin 3; (F) defensin 4; (G) bacteria 16S. The y-axis represents relative expression values expressed in foldchange in comparison to the pre-pupae stage. The x-axis represents larval stages L3, L4, and pre-pupal (PP). Vertical bars represent the average values of three independent experiments, and error bars represent the standard error. Asterisks indicate significant differences (* p < 0.05; *** p < 0.001; **** p < 0.0001). (nd) not detected.

